Immigrants from Austria vs Ethiopian 6th Grade
COMPARE
Immigrants from Austria
Ethiopian
6th Grade
6th Grade Comparison
Immigrants from Austria
Ethiopians
97.7%
6TH GRADE
99.6/ 100
METRIC RATING
68th/ 347
METRIC RANK
96.6%
6TH GRADE
1.5/ 100
METRIC RATING
244th/ 347
METRIC RANK
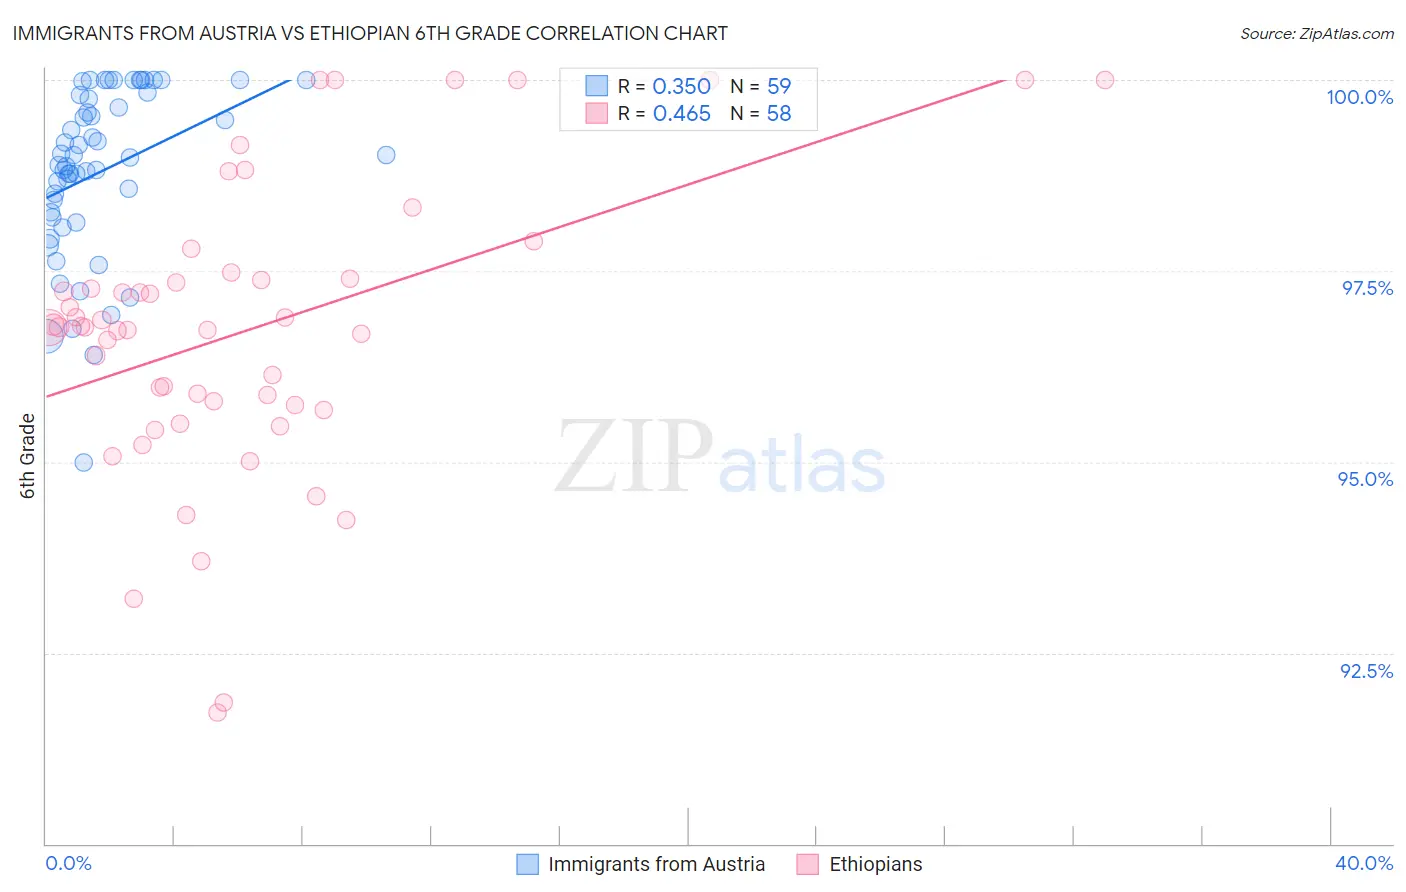
Immigrants from Austria vs Ethiopian 6th Grade Correlation Chart
The statistical analysis conducted on geographies consisting of 167,973,800 people shows a mild positive correlation between the proportion of Immigrants from Austria and percentage of population with at least 6th grade education in the United States with a correlation coefficient (R) of 0.350 and weighted average of 97.7%. Similarly, the statistical analysis conducted on geographies consisting of 223,120,541 people shows a moderate positive correlation between the proportion of Ethiopians and percentage of population with at least 6th grade education in the United States with a correlation coefficient (R) of 0.465 and weighted average of 96.6%, a difference of 1.1%.
6th Grade Correlation Summary
| Measurement | Immigrants from Austria | Ethiopian |
| Minimum | 95.0% | 91.7% |
| Maximum | 100.0% | 100.0% |
| Range | 5.0% | 8.3% |
| Mean | 98.8% | 96.7% |
| Median | 99.0% | 96.8% |
| Interquartile 25% (IQ1) | 98.2% | 95.7% |
| Interquartile 75% (IQ3) | 99.8% | 97.4% |
| Interquartile Range (IQR) | 1.6% | 1.7% |
| Standard Deviation (Sample) | 1.1% | 1.9% |
| Standard Deviation (Population) | 1.1% | 1.9% |
Similar Demographics by 6th Grade
Demographics Similar to Immigrants from Austria by 6th Grade
In terms of 6th grade, the demographic groups most similar to Immigrants from Austria are New Zealander (97.7%, a difference of 0.0%), Kiowa (97.7%, a difference of 0.0%), Immigrants from Northern Europe (97.7%, a difference of 0.010%), Russian (97.7%, a difference of 0.020%), and Canadian (97.7%, a difference of 0.020%).
| Demographics | Rating | Rank | 6th Grade |
| Serbians | 99.7 /100 | #61 | Exceptional 97.7% |
| Immigrants | North America | 99.7 /100 | #62 | Exceptional 97.7% |
| Russians | 99.7 /100 | #63 | Exceptional 97.7% |
| Canadians | 99.7 /100 | #64 | Exceptional 97.7% |
| Immigrants | Northern Europe | 99.6 /100 | #65 | Exceptional 97.7% |
| New Zealanders | 99.6 /100 | #66 | Exceptional 97.7% |
| Kiowa | 99.6 /100 | #67 | Exceptional 97.7% |
| Immigrants | Austria | 99.6 /100 | #68 | Exceptional 97.7% |
| Iranians | 99.6 /100 | #69 | Exceptional 97.6% |
| Cajuns | 99.5 /100 | #70 | Exceptional 97.6% |
| Chickasaw | 99.5 /100 | #71 | Exceptional 97.6% |
| Macedonians | 99.4 /100 | #72 | Exceptional 97.6% |
| Cherokee | 99.4 /100 | #73 | Exceptional 97.6% |
| Immigrants | Netherlands | 99.4 /100 | #74 | Exceptional 97.6% |
| Ukrainians | 99.4 /100 | #75 | Exceptional 97.6% |
Demographics Similar to Ethiopians by 6th Grade
In terms of 6th grade, the demographic groups most similar to Ethiopians are Immigrants from Liberia (96.6%, a difference of 0.010%), Senegalese (96.6%, a difference of 0.020%), Immigrants from Asia (96.6%, a difference of 0.020%), Immigrants from Costa Rica (96.6%, a difference of 0.020%), and Immigrants from Africa (96.6%, a difference of 0.020%).
| Demographics | Rating | Rank | 6th Grade |
| Immigrants | Eastern Africa | 2.0 /100 | #237 | Tragic 96.6% |
| Nigerians | 1.9 /100 | #238 | Tragic 96.6% |
| Indians (Asian) | 1.9 /100 | #239 | Tragic 96.6% |
| Koreans | 1.9 /100 | #240 | Tragic 96.6% |
| Senegalese | 1.8 /100 | #241 | Tragic 96.6% |
| Immigrants | Asia | 1.8 /100 | #242 | Tragic 96.6% |
| Immigrants | Liberia | 1.6 /100 | #243 | Tragic 96.6% |
| Ethiopians | 1.5 /100 | #244 | Tragic 96.6% |
| Immigrants | Costa Rica | 1.3 /100 | #245 | Tragic 96.6% |
| Immigrants | Africa | 1.3 /100 | #246 | Tragic 96.6% |
| Bolivians | 1.0 /100 | #247 | Tragic 96.5% |
| Tohono O'odham | 1.0 /100 | #248 | Tragic 96.5% |
| Colombians | 0.9 /100 | #249 | Tragic 96.5% |
| Immigrants | Middle Africa | 0.8 /100 | #250 | Tragic 96.5% |
| Immigrants | Senegal | 0.7 /100 | #251 | Tragic 96.5% |