Immigrants from Argentina vs Immigrants from Thailand In Labor Force | Age 20-24

COMPARE

Immigrants from Argentina
Race
Ancestry
AfghanAfricanAlaska NativeAlaskan AthabascanAlbanianAleutAlsatianAmericanApacheArabArapahoArgentineanArmenianAssyrian/Chaldean/SyriacAustralianAustrianBahamianBangladeshiBarbadianBasqueBelgianBelizeanBermudanBhutaneseBlackfeetBolivianBrazilianBritishBritish West IndianBulgarianBurmeseCajunCambodianCanadianCape VerdeanCarpatho RusynCelticCentral AmericanCentral American IndianCherokeeCheyenneChickasawChileanChineseChippewaChoctawColombianColvilleComancheCosta RicanCreeCreekCroatianCrowCubanCypriotCzechCzechoslovakianDanishDelawareDominicanDutchDutch West IndianEastern EuropeanEcuadorianEgyptianEnglishEstonianEthiopianEuropeanFijianFilipinoFinnishFrenchFrench American IndianFrench CanadianGermanGerman RussianGhanaianGreekGuamanian/ChamorroGuatemalanGuyaneseHaitianHmongHonduranHopiHoumaHungarianIcelanderIndian (Asian)IndonesianInupiatIranianIraqiIrishIroquoisIsraeliItalianJamaicanJapaneseJordanianKenyanKiowaKoreanLaotianLatvianLebaneseLiberianLithuanianLumbeeLuxembourgerMacedonianMalaysianMalteseMarshalleseMenomineeMexicanMexican American IndianMongolianMoroccanNative HawaiianNavajoNepaleseNew ZealanderNicaraguanNigerianNorthern EuropeanNorwegianOkinawanOsageOttawaPaiutePakistaniPalestinianPanamanianParaguayanPennsylvania GermanPeruvianPimaPolishPortuguesePotawatomiPuebloPuerto RicanPuget Sound SalishRomanianRussianSalvadoranSamoanScandinavianScotch-IrishScottishSeminoleSenegaleseSerbianShoshoneSierra LeoneanSiouxSlavicSlovakSloveneSomaliSouth AfricanSouth AmericanSouth American IndianSoviet UnionSpaniardSpanishSpanish AmericanSpanish American IndianSri LankanSubsaharan AfricanSudaneseSwedishSwissSyrianTaiwaneseThaiTlingit-HaidaTohono O'OdhamTonganTrinidadian and TobagonianTsimshianTurkishU.S. Virgin IslanderUgandanUkrainianUruguayanUteVenezuelanVietnameseWelshWest IndianYakamaYaquiYugoslavianYumanYup'ikZimbabwean
Immigration
NonimmigrantsImmigrantsAfghanistanAfricaAlbaniaArgentinaArmeniaAsiaAustraliaAustriaBahamasBangladeshBarbadosBelarusBelgiumBelizeBoliviaBosnia and HerzegovinaBrazilBulgariaBurma/MyanmarCabo VerdeCambodiaCameroonCanadaCaribbeanCentral AmericaChileChinaColombiaCongoCosta RicaCroatiaCubaCzechoslovakiaDenmarkDominicaDominican RepublicEastern AfricaEastern AsiaEastern EuropeEcuadorEgyptEl SalvadorEnglandEritreaEthiopiaEuropeFijiFranceGermanyGhanaGreeceGrenadaGuatemalaGuyanaHaitiHondurasHong KongHungaryIndiaIndonesiaIranIraqIrelandIsraelItalyJamaicaJapanJordanKazakhstanKenyaKoreaKuwaitLaosLatin AmericaLatviaLebanonLiberiaLithuaniaMalaysiaMexicoMicronesiaMiddle AfricaMoldovaMoroccoNepalNetherlandsNicaraguaNigeriaNorth AmericaNorth MacedoniaNorthern AfricaNorthern EuropeNorwayOceaniaPakistanPanamaPeruPhilippinesPolandPortugalRomaniaRussiaSaudi ArabiaScotlandSenegalSerbiaSierra LeoneSingaporeSomaliaSouth AfricaSouth AmericaSouth Central AsiaSouth Eastern AsiaSouthern EuropeSpainSri LankaSt. Vincent and the GrenadinesSudanSwedenSwitzerlandSyriaTaiwanTrinidad and TobagoTurkeyUgandaUkraineUruguayUzbekistanVenezuelaVietnamWest IndiesWestern AfricaWestern AsiaWestern EuropeYemenZaireZimbabweAzores
Immigrants from Thailand
Race
Ancestry
AfghanAfricanAlaska NativeAlaskan AthabascanAlbanianAleutAlsatianAmericanApacheArabArapahoArgentineanArmenianAssyrian/Chaldean/SyriacAustralianAustrianBahamianBangladeshiBarbadianBasqueBelgianBelizeanBermudanBhutaneseBlackfeetBolivianBrazilianBritishBritish West IndianBulgarianBurmeseCajunCambodianCanadianCape VerdeanCarpatho RusynCelticCentral AmericanCentral American IndianCherokeeCheyenneChickasawChileanChineseChippewaChoctawColombianColvilleComancheCosta RicanCreeCreekCroatianCrowCubanCypriotCzechCzechoslovakianDanishDelawareDominicanDutchDutch West IndianEastern EuropeanEcuadorianEgyptianEnglishEstonianEthiopianEuropeanFijianFilipinoFinnishFrenchFrench American IndianFrench CanadianGermanGerman RussianGhanaianGreekGuamanian/ChamorroGuatemalanGuyaneseHaitianHmongHonduranHopiHoumaHungarianIcelanderIndian (Asian)IndonesianInupiatIranianIraqiIrishIroquoisIsraeliItalianJamaicanJapaneseJordanianKenyanKiowaKoreanLaotianLatvianLebaneseLiberianLithuanianLumbeeLuxembourgerMacedonianMalaysianMalteseMarshalleseMenomineeMexicanMexican American IndianMongolianMoroccanNative HawaiianNavajoNepaleseNew ZealanderNicaraguanNigerianNorthern EuropeanNorwegianOkinawanOsageOttawaPaiutePakistaniPalestinianPanamanianParaguayanPennsylvania GermanPeruvianPimaPolishPortuguesePotawatomiPuebloPuerto RicanPuget Sound SalishRomanianRussianSalvadoranSamoanScandinavianScotch-IrishScottishSeminoleSenegaleseSerbianShoshoneSierra LeoneanSiouxSlavicSlovakSloveneSomaliSouth AfricanSouth AmericanSouth American IndianSoviet UnionSpaniardSpanishSpanish AmericanSpanish American IndianSri LankanSubsaharan AfricanSudaneseSwedishSwissSyrianTaiwaneseThaiTlingit-HaidaTohono O'OdhamTonganTrinidadian and TobagonianTsimshianTurkishU.S. Virgin IslanderUgandanUkrainianUruguayanUteVenezuelanVietnameseWelshWest IndianYakamaYaquiYugoslavianYumanYup'ikZimbabwean
Immigration
NonimmigrantsImmigrantsAfghanistanAfricaAlbaniaArmeniaAsiaAustraliaAustriaBahamasBangladeshBarbadosBelarusBelgiumBelizeBoliviaBosnia and HerzegovinaBrazilBulgariaBurma/MyanmarCabo VerdeCambodiaCameroonCanadaCaribbeanCentral AmericaChileChinaColombiaCongoCosta RicaCroatiaCubaCzechoslovakiaDenmarkDominicaDominican RepublicEastern AfricaEastern AsiaEastern EuropeEcuadorEgyptEl SalvadorEnglandEritreaEthiopiaEuropeFijiFranceGermanyGhanaGreeceGrenadaGuatemalaGuyanaHaitiHondurasHong KongHungaryIndiaIndonesiaIranIraqIrelandIsraelItalyJamaicaJapanJordanKazakhstanKenyaKoreaKuwaitLaosLatin AmericaLatviaLebanonLiberiaLithuaniaMalaysiaMexicoMicronesiaMiddle AfricaMoldovaMoroccoNepalNetherlandsNicaraguaNigeriaNorth AmericaNorth MacedoniaNorthern AfricaNorthern EuropeNorwayOceaniaPakistanPanamaPeruPhilippinesPolandPortugalRomaniaRussiaSaudi ArabiaScotlandSenegalSerbiaSierra LeoneSingaporeSomaliaSouth AfricaSouth AmericaSouth Central AsiaSouth Eastern AsiaSouthern EuropeSpainSri LankaSt. Vincent and the GrenadinesSudanSwedenSwitzerlandSyriaTaiwanThailandTrinidad and TobagoTurkeyUgandaUkraineUruguayUzbekistanVenezuelaVietnamWest IndiesWestern AfricaWestern AsiaWestern EuropeYemenZaireZimbabweAzores
In Labor Force | Age 20-24
Income
Poverty
Unemployment
Labor Participation
Family Structure
Vehicle Availability
Education Level
Disability

In Labor Force | Age 20-24 Comparison

Immigrants from Argentina

Immigrants from Thailand

Tragic
Exceptional
72.8%
IN LABOR FORCE | AGE 20-24
0.0/ 100
METRIC RATING
294th/ 347
METRIC RANK
76.4%
IN LABOR FORCE | AGE 20-24
99.3/ 100
METRIC RATING
87th/ 347
METRIC RANK

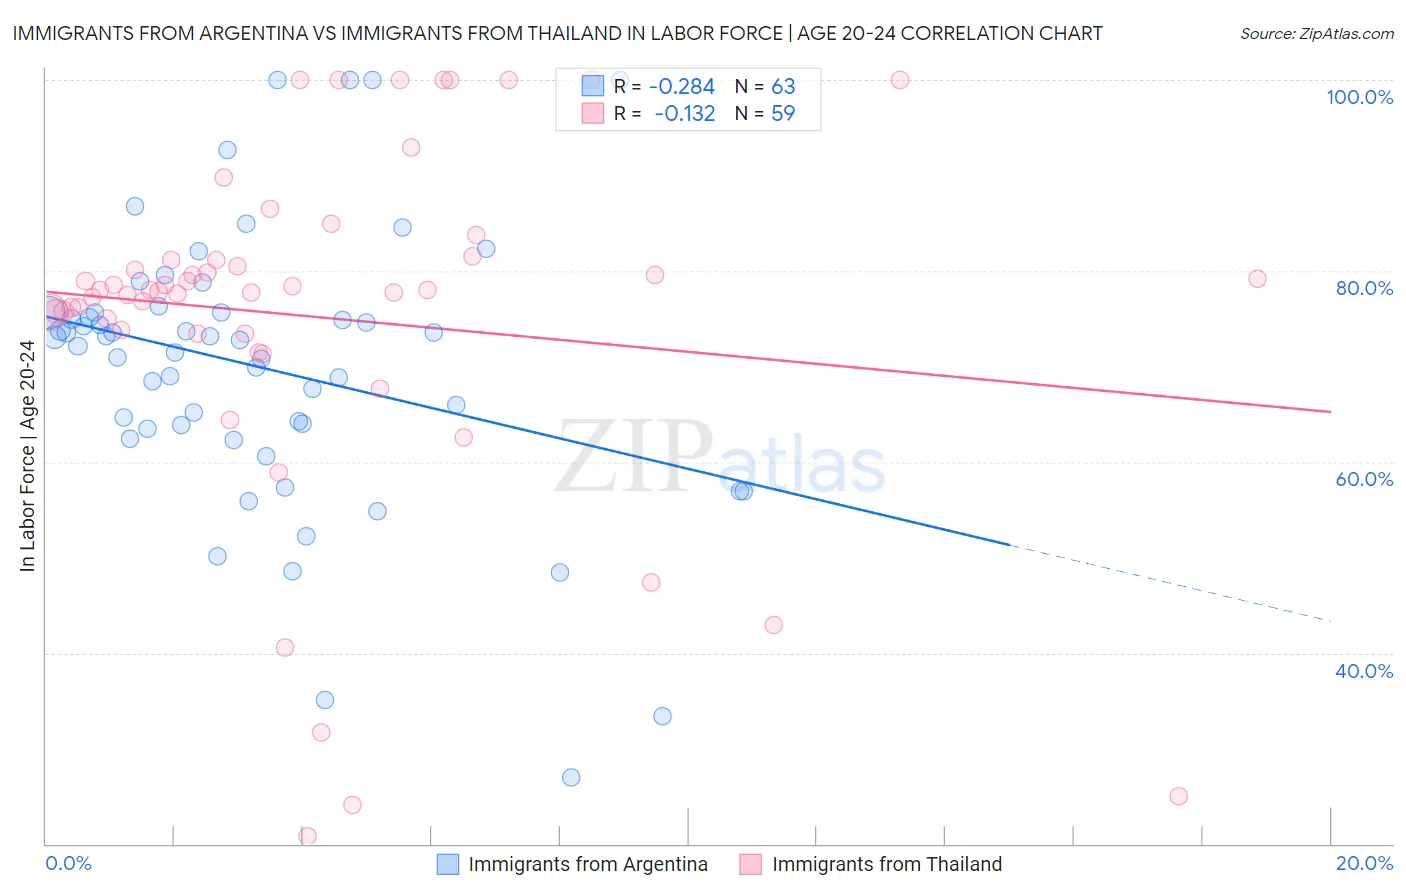
Immigrants from Argentina vs Immigrants from Thailand In Labor Force | Age 20-24 Correlation Chart

The statistical analysis conducted on geographies consisting of 264,369,476 people shows a weak negative correlation between the proportion of Immigrants from Argentina and labor force participation rate among population between the ages 20 and 24 in the United States with a correlation coefficient (R) of -0.284 and weighted average of 72.8%. Similarly, the statistical analysis conducted on geographies consisting of 316,957,721 people shows a poor negative correlation between the proportion of Immigrants from Thailand and labor force participation rate among population between the ages 20 and 24 in the United States with a correlation coefficient (R) of -0.132 and weighted average of 76.4%, a difference of 5.0%.
Immigrants from Argentina vs Immigrants from Thailand In Labor Force | Age 20-24

In Labor Force | Age 20-24 Correlation Summary

MeasurementImmigrants from ArgentinaImmigrants from Thailand
Minimum26.9%20.8%
Maximum100.0%100.0%
Range73.1%79.2%
Mean69.9%75.2%
Median72.8%78.0%
Interquartile 25% (IQ1)63.5%73.4%
Interquartile 75% (IQ3)75.7%81.1%
Interquartile Range (IQR)12.2%7.7%
Standard Deviation (Sample)14.6%18.5%
Standard Deviation (Population)14.5%18.3%

Similar Demographics by In Labor Force | Age 20-24

Demographics Similar to Immigrants from Argentina by In Labor Force | Age 20-24

In terms of in labor force | age 20-24, the demographic groups most similar to Immigrants from Argentina are Immigrants from Belize (72.8%, a difference of 0.030%), Pueblo (72.9%, a difference of 0.090%), Okinawan (72.7%, a difference of 0.11%), Jamaican (72.7%, a difference of 0.11%), and Central American Indian (72.7%, a difference of 0.16%).
DemographicsRating | RankIn Labor Force | Age 20-24
Immigrants | Korea
0.1
/100
|
#287
Tragic
73.1%
Argentineans
0.1
/100
|
#288
Tragic
73.1%
U.S. Virgin Islanders
0.1
/100
|
#289
Tragic
73.0%
Immigrants | Belarus
0.1
/100
|
#290
Tragic
73.0%
Immigrants | Nicaragua
0.0
/100
|
#291
Tragic
72.9%
Pueblo
0.0
/100
|
#292
Tragic
72.9%
Immigrants | Belize
0.0
/100
|
#293
Tragic
72.8%
Immigrants | Argentina
0.0
/100
|
#294
Tragic
72.8%
Okinawans
0.0
/100
|
#295
Tragic
72.7%
Jamaicans
0.0
/100
|
#296
Tragic
72.7%
Central American Indians
0.0
/100
|
#297
Tragic
72.7%
Israelis
0.0
/100
|
#298
Tragic
72.6%
Iranians
0.0
/100
|
#299
Tragic
72.6%
Armenians
0.0
/100
|
#300
Tragic
72.5%
Cubans
0.0
/100
|
#301
Tragic
72.5%

Demographics Similar to Immigrants from Thailand by In Labor Force | Age 20-24

In terms of in labor force | age 20-24, the demographic groups most similar to Immigrants from Thailand are Immigrants from Iraq (76.4%, a difference of 0.0%), Portuguese (76.4%, a difference of 0.030%), Austrian (76.5%, a difference of 0.050%), Spanish (76.4%, a difference of 0.050%), and Carpatho Rusyn (76.5%, a difference of 0.060%).
DemographicsRating | RankIn Labor Force | Age 20-24
Italians
99.6
/100
|
#80
Exceptional
76.5%
Basques
99.5
/100
|
#81
Exceptional
76.5%
Hmong
99.5
/100
|
#82
Exceptional
76.5%
Carpatho Rusyns
99.4
/100
|
#83
Exceptional
76.5%
Austrians
99.4
/100
|
#84
Exceptional
76.5%
Portuguese
99.3
/100
|
#85
Exceptional
76.4%
Immigrants | Iraq
99.3
/100
|
#86
Exceptional
76.4%
Immigrants | Thailand
99.3
/100
|
#87
Exceptional
76.4%
Spanish
99.2
/100
|
#88
Exceptional
76.4%
Bulgarians
99.2
/100
|
#89
Exceptional
76.4%
Immigrants | Burma/Myanmar
99.1
/100
|
#90
Exceptional
76.3%
Sierra Leoneans
99.0
/100
|
#91
Exceptional
76.3%
Maltese
98.9
/100
|
#92
Exceptional
76.3%
Hungarians
98.9
/100
|
#93
Exceptional
76.3%
Potawatomi
98.5
/100
|
#94
Exceptional
76.2%