Immigrants from Argentina vs Immigrants from Thailand Female Disability
COMPARE
Immigrants from Argentina
Immigrants from Thailand
Female Disability
Female Disability Comparison
Immigrants from Argentina
Immigrants from Thailand
11.0%
FEMALE DISABILITY
100.0/ 100
METRIC RATING
24th/ 347
METRIC RANK
12.4%
FEMALE DISABILITY
14.5/ 100
METRIC RATING
213th/ 347
METRIC RANK
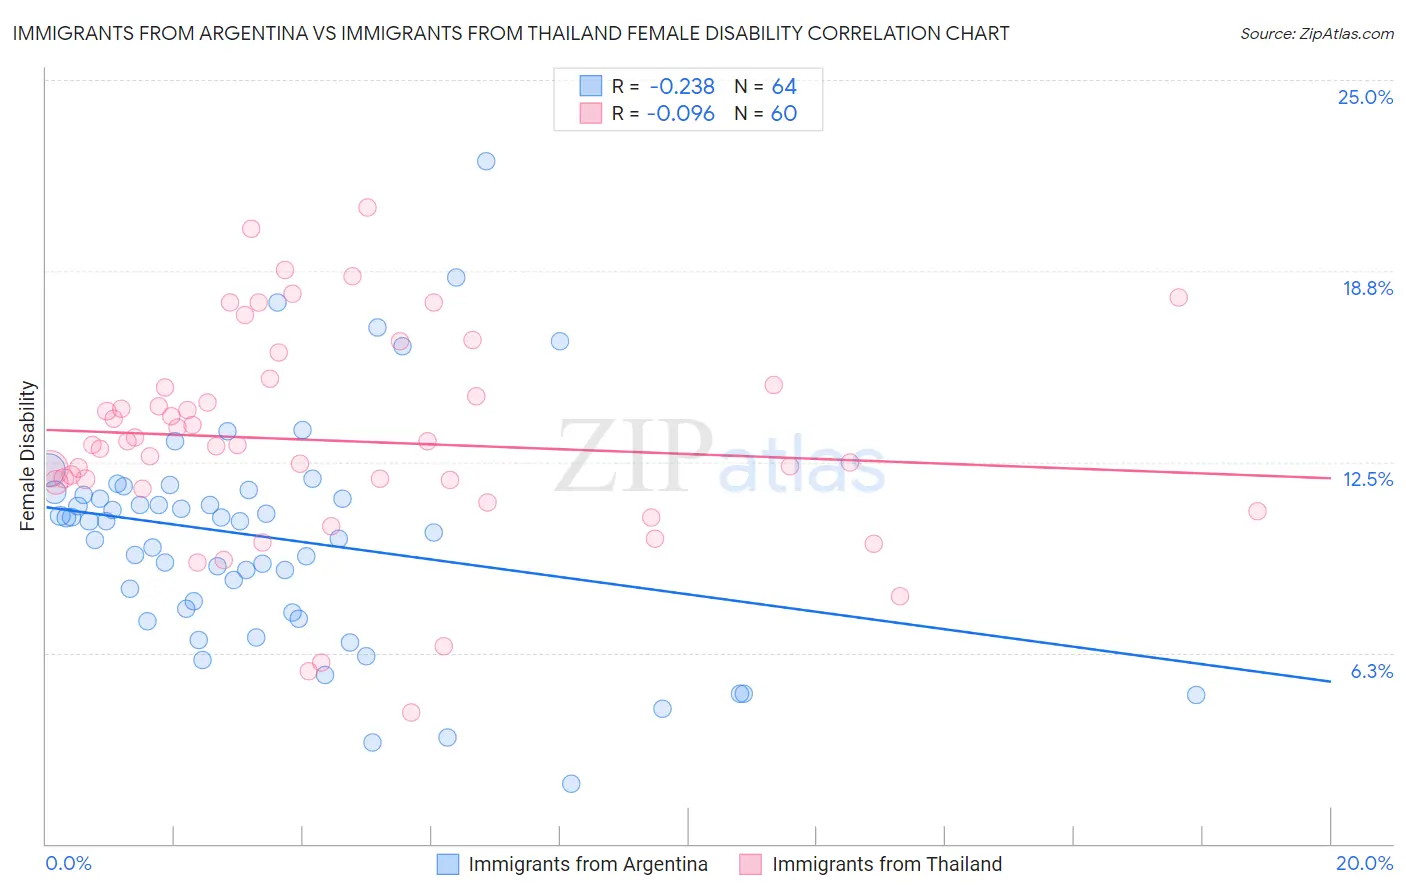
Immigrants from Argentina vs Immigrants from Thailand Female Disability Correlation Chart
The statistical analysis conducted on geographies consisting of 264,430,891 people shows a weak negative correlation between the proportion of Immigrants from Argentina and percentage of females with a disability in the United States with a correlation coefficient (R) of -0.238 and weighted average of 11.0%. Similarly, the statistical analysis conducted on geographies consisting of 316,982,742 people shows a slight negative correlation between the proportion of Immigrants from Thailand and percentage of females with a disability in the United States with a correlation coefficient (R) of -0.096 and weighted average of 12.4%, a difference of 12.6%.
Female Disability Correlation Summary
| Measurement | Immigrants from Argentina | Immigrants from Thailand |
| Minimum | 1.9% | 4.3% |
| Maximum | 22.3% | 20.8% |
| Range | 20.4% | 16.5% |
| Mean | 10.0% | 13.2% |
| Median | 10.6% | 13.1% |
| Interquartile 25% (IQ1) | 7.6% | 11.7% |
| Interquartile 75% (IQ3) | 11.5% | 15.0% |
| Interquartile Range (IQR) | 3.8% | 3.3% |
| Standard Deviation (Sample) | 3.7% | 3.5% |
| Standard Deviation (Population) | 3.7% | 3.4% |
Similar Demographics by Female Disability
Demographics Similar to Immigrants from Argentina by Female Disability
In terms of female disability, the demographic groups most similar to Immigrants from Argentina are Immigrants from Asia (11.0%, a difference of 0.030%), Argentinean (11.0%, a difference of 0.070%), Immigrants from Turkey (11.1%, a difference of 0.47%), Venezuelan (11.0%, a difference of 0.57%), and Egyptian (11.1%, a difference of 0.74%).
| Demographics | Rating | Rank | Female Disability |
| Indians (Asian) | 100.0 /100 | #17 | Exceptional 10.8% |
| Immigrants | Iran | 100.0 /100 | #18 | Exceptional 10.8% |
| Immigrants | Venezuela | 100.0 /100 | #19 | Exceptional 10.9% |
| Immigrants | Pakistan | 100.0 /100 | #20 | Exceptional 10.9% |
| Asians | 100.0 /100 | #21 | Exceptional 10.9% |
| Immigrants | Sri Lanka | 100.0 /100 | #22 | Exceptional 10.9% |
| Venezuelans | 100.0 /100 | #23 | Exceptional 11.0% |
| Immigrants | Argentina | 100.0 /100 | #24 | Exceptional 11.0% |
| Immigrants | Asia | 100.0 /100 | #25 | Exceptional 11.0% |
| Argentineans | 100.0 /100 | #26 | Exceptional 11.0% |
| Immigrants | Turkey | 100.0 /100 | #27 | Exceptional 11.1% |
| Egyptians | 100.0 /100 | #28 | Exceptional 11.1% |
| Immigrants | Malaysia | 100.0 /100 | #29 | Exceptional 11.1% |
| Turks | 100.0 /100 | #30 | Exceptional 11.1% |
| Immigrants | Kuwait | 100.0 /100 | #31 | Exceptional 11.1% |
Demographics Similar to Immigrants from Thailand by Female Disability
In terms of female disability, the demographic groups most similar to Immigrants from Thailand are Ute (12.4%, a difference of 0.020%), Swiss (12.4%, a difference of 0.030%), Immigrants from Bosnia and Herzegovina (12.4%, a difference of 0.030%), Panamanian (12.4%, a difference of 0.080%), and Samoan (12.4%, a difference of 0.080%).
| Demographics | Rating | Rank | Female Disability |
| Immigrants | Cuba | 20.2 /100 | #206 | Fair 12.4% |
| Croatians | 20.2 /100 | #207 | Fair 12.4% |
| Basques | 17.5 /100 | #208 | Poor 12.4% |
| Mexicans | 15.7 /100 | #209 | Poor 12.4% |
| Swiss | 14.9 /100 | #210 | Poor 12.4% |
| Immigrants | Bosnia and Herzegovina | 14.8 /100 | #211 | Poor 12.4% |
| Ute | 14.7 /100 | #212 | Poor 12.4% |
| Immigrants | Thailand | 14.5 /100 | #213 | Poor 12.4% |
| Panamanians | 13.5 /100 | #214 | Poor 12.4% |
| Samoans | 13.4 /100 | #215 | Poor 12.4% |
| Immigrants | Burma/Myanmar | 13.3 /100 | #216 | Poor 12.4% |
| British | 12.7 /100 | #217 | Poor 12.4% |
| Immigrants | Bahamas | 12.5 /100 | #218 | Poor 12.4% |
| Europeans | 12.1 /100 | #219 | Poor 12.4% |
| Bahamians | 11.1 /100 | #220 | Poor 12.4% |