Yugoslavian vs Immigrants from Thailand In Labor Force | Age 20-24
COMPARE
Yugoslavian
Immigrants from Thailand
In Labor Force | Age 20-24
In Labor Force | Age 20-24 Comparison
Yugoslavians
Immigrants from Thailand
78.0%
IN LABOR FORCE | AGE 20-24
100.0/ 100
METRIC RATING
23rd/ 347
METRIC RANK
76.4%
IN LABOR FORCE | AGE 20-24
99.3/ 100
METRIC RATING
87th/ 347
METRIC RANK
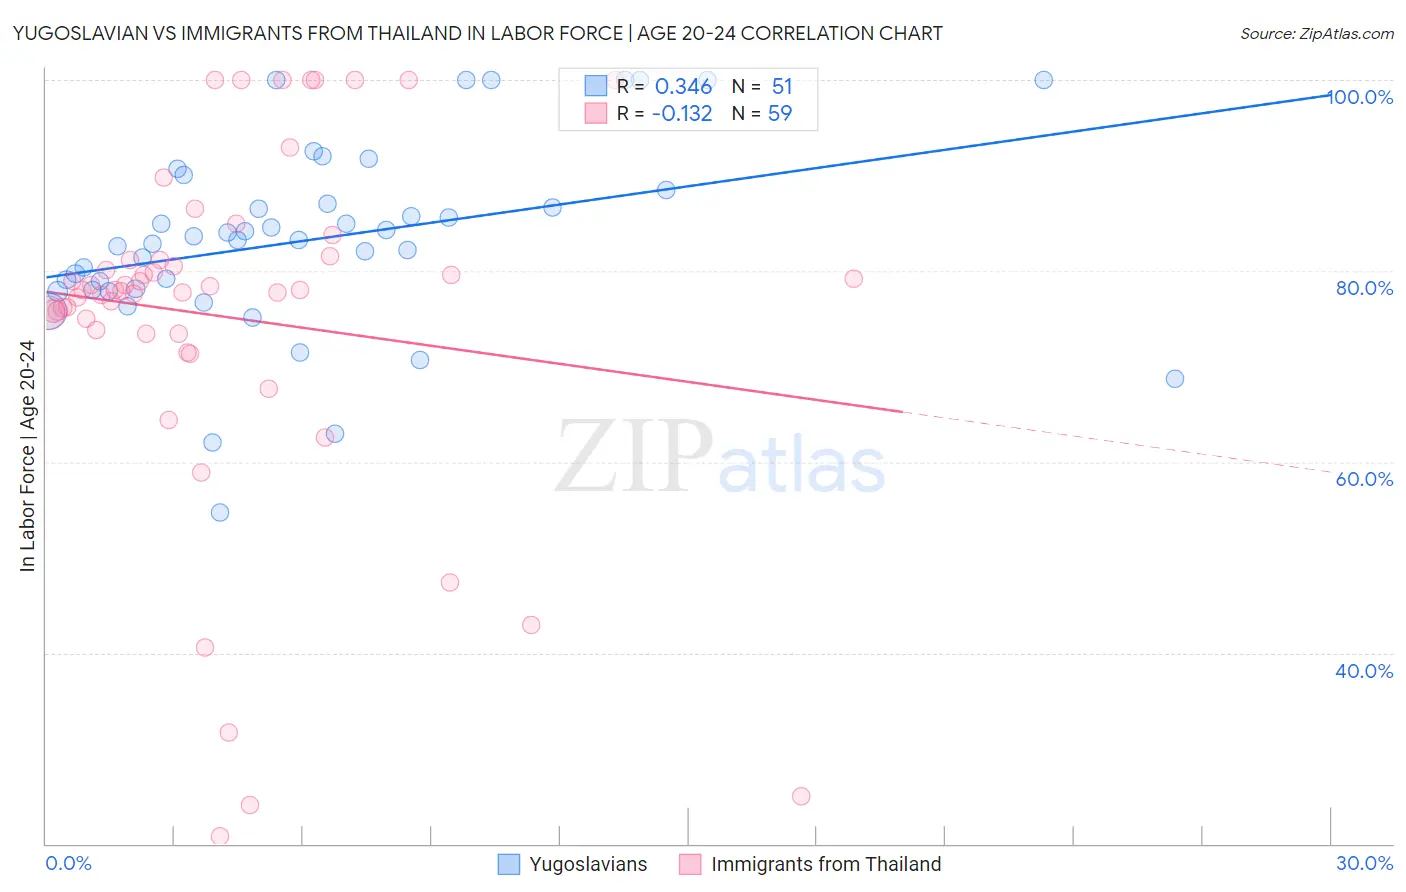
Yugoslavian vs Immigrants from Thailand In Labor Force | Age 20-24 Correlation Chart
The statistical analysis conducted on geographies consisting of 285,583,037 people shows a mild positive correlation between the proportion of Yugoslavians and labor force participation rate among population between the ages 20 and 24 in the United States with a correlation coefficient (R) of 0.346 and weighted average of 78.0%. Similarly, the statistical analysis conducted on geographies consisting of 316,957,721 people shows a poor negative correlation between the proportion of Immigrants from Thailand and labor force participation rate among population between the ages 20 and 24 in the United States with a correlation coefficient (R) of -0.132 and weighted average of 76.4%, a difference of 2.0%.
In Labor Force | Age 20-24 Correlation Summary
| Measurement | Yugoslavian | Immigrants from Thailand |
| Minimum | 54.7% | 20.8% |
| Maximum | 100.0% | 100.0% |
| Range | 45.3% | 79.2% |
| Mean | 83.3% | 75.2% |
| Median | 83.3% | 78.0% |
| Interquartile 25% (IQ1) | 78.0% | 73.4% |
| Interquartile 75% (IQ3) | 88.5% | 81.1% |
| Interquartile Range (IQR) | 10.5% | 7.7% |
| Standard Deviation (Sample) | 10.0% | 18.5% |
| Standard Deviation (Population) | 9.9% | 18.3% |
Similar Demographics by In Labor Force | Age 20-24
Demographics Similar to Yugoslavians by In Labor Force | Age 20-24
In terms of in labor force | age 20-24, the demographic groups most similar to Yugoslavians are Liberian (78.0%, a difference of 0.0%), Pennsylvania German (78.0%, a difference of 0.010%), Tlingit-Haida (77.9%, a difference of 0.040%), Tongan (77.9%, a difference of 0.060%), and Puget Sound Salish (78.0%, a difference of 0.070%).
| Demographics | Rating | Rank | In Labor Force | Age 20-24 |
| Dutch | 100.0 /100 | #16 | Exceptional 78.4% |
| Cape Verdeans | 100.0 /100 | #17 | Exceptional 78.3% |
| Immigrants | Bosnia and Herzegovina | 100.0 /100 | #18 | Exceptional 78.1% |
| Bangladeshis | 100.0 /100 | #19 | Exceptional 78.1% |
| French Canadians | 100.0 /100 | #20 | Exceptional 78.1% |
| Puget Sound Salish | 100.0 /100 | #21 | Exceptional 78.0% |
| Pennsylvania Germans | 100.0 /100 | #22 | Exceptional 78.0% |
| Yugoslavians | 100.0 /100 | #23 | Exceptional 78.0% |
| Liberians | 100.0 /100 | #24 | Exceptional 78.0% |
| Tlingit-Haida | 100.0 /100 | #25 | Exceptional 77.9% |
| Tongans | 100.0 /100 | #26 | Exceptional 77.9% |
| Immigrants | Micronesia | 100.0 /100 | #27 | Exceptional 77.8% |
| Belgians | 100.0 /100 | #28 | Exceptional 77.8% |
| Slovaks | 100.0 /100 | #29 | Exceptional 77.7% |
| Swiss | 100.0 /100 | #30 | Exceptional 77.7% |
Demographics Similar to Immigrants from Thailand by In Labor Force | Age 20-24
In terms of in labor force | age 20-24, the demographic groups most similar to Immigrants from Thailand are Immigrants from Iraq (76.4%, a difference of 0.0%), Portuguese (76.4%, a difference of 0.030%), Austrian (76.5%, a difference of 0.050%), Spanish (76.4%, a difference of 0.050%), and Carpatho Rusyn (76.5%, a difference of 0.060%).
| Demographics | Rating | Rank | In Labor Force | Age 20-24 |
| Italians | 99.6 /100 | #80 | Exceptional 76.5% |
| Basques | 99.5 /100 | #81 | Exceptional 76.5% |
| Hmong | 99.5 /100 | #82 | Exceptional 76.5% |
| Carpatho Rusyns | 99.4 /100 | #83 | Exceptional 76.5% |
| Austrians | 99.4 /100 | #84 | Exceptional 76.5% |
| Portuguese | 99.3 /100 | #85 | Exceptional 76.4% |
| Immigrants | Iraq | 99.3 /100 | #86 | Exceptional 76.4% |
| Immigrants | Thailand | 99.3 /100 | #87 | Exceptional 76.4% |
| Spanish | 99.2 /100 | #88 | Exceptional 76.4% |
| Bulgarians | 99.2 /100 | #89 | Exceptional 76.4% |
| Immigrants | Burma/Myanmar | 99.1 /100 | #90 | Exceptional 76.3% |
| Sierra Leoneans | 99.0 /100 | #91 | Exceptional 76.3% |
| Maltese | 98.9 /100 | #92 | Exceptional 76.3% |
| Hungarians | 98.9 /100 | #93 | Exceptional 76.3% |
| Potawatomi | 98.5 /100 | #94 | Exceptional 76.2% |