Immigrants from Bahamas vs Immigrants from Thailand In Labor Force | Age 20-24
COMPARE
Immigrants from Bahamas
Immigrants from Thailand
In Labor Force | Age 20-24
In Labor Force | Age 20-24 Comparison
Immigrants from Bahamas
Immigrants from Thailand
73.2%
IN LABOR FORCE | AGE 20-24
0.1/ 100
METRIC RATING
283rd/ 347
METRIC RANK
76.4%
IN LABOR FORCE | AGE 20-24
99.3/ 100
METRIC RATING
87th/ 347
METRIC RANK
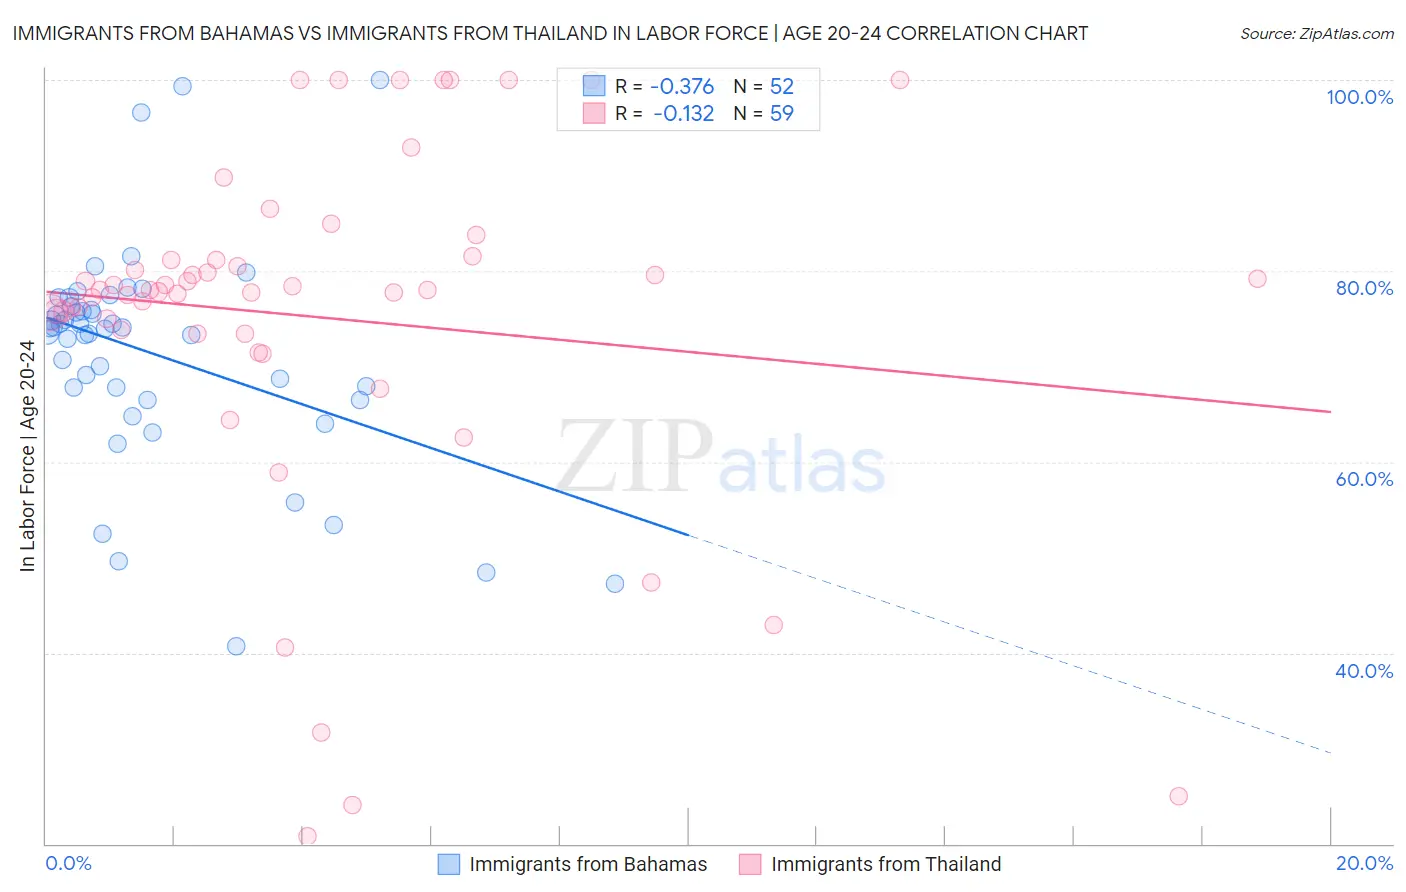
Immigrants from Bahamas vs Immigrants from Thailand In Labor Force | Age 20-24 Correlation Chart
The statistical analysis conducted on geographies consisting of 104,660,566 people shows a mild negative correlation between the proportion of Immigrants from Bahamas and labor force participation rate among population between the ages 20 and 24 in the United States with a correlation coefficient (R) of -0.376 and weighted average of 73.2%. Similarly, the statistical analysis conducted on geographies consisting of 316,957,721 people shows a poor negative correlation between the proportion of Immigrants from Thailand and labor force participation rate among population between the ages 20 and 24 in the United States with a correlation coefficient (R) of -0.132 and weighted average of 76.4%, a difference of 4.3%.
In Labor Force | Age 20-24 Correlation Summary
| Measurement | Immigrants from Bahamas | Immigrants from Thailand |
| Minimum | 40.7% | 20.8% |
| Maximum | 100.0% | 100.0% |
| Range | 59.3% | 79.2% |
| Mean | 71.4% | 75.2% |
| Median | 74.0% | 78.0% |
| Interquartile 25% (IQ1) | 67.2% | 73.4% |
| Interquartile 75% (IQ3) | 76.2% | 81.1% |
| Interquartile Range (IQR) | 9.0% | 7.7% |
| Standard Deviation (Sample) | 11.5% | 18.5% |
| Standard Deviation (Population) | 11.4% | 18.3% |
Similar Demographics by In Labor Force | Age 20-24
Demographics Similar to Immigrants from Bahamas by In Labor Force | Age 20-24
In terms of in labor force | age 20-24, the demographic groups most similar to Immigrants from Bahamas are Immigrants from Venezuela (73.2%, a difference of 0.010%), Immigrants from Spain (73.2%, a difference of 0.010%), Kiowa (73.2%, a difference of 0.020%), Bahamian (73.3%, a difference of 0.050%), and Nicaraguan (73.2%, a difference of 0.080%).
| Demographics | Rating | Rank | In Labor Force | Age 20-24 |
| Mongolians | 0.2 /100 | #276 | Tragic 73.3% |
| Immigrants | Malaysia | 0.2 /100 | #277 | Tragic 73.3% |
| Cypriots | 0.2 /100 | #278 | Tragic 73.3% |
| Venezuelans | 0.2 /100 | #279 | Tragic 73.3% |
| Bahamians | 0.1 /100 | #280 | Tragic 73.3% |
| Immigrants | Venezuela | 0.1 /100 | #281 | Tragic 73.2% |
| Immigrants | Spain | 0.1 /100 | #282 | Tragic 73.2% |
| Immigrants | Bahamas | 0.1 /100 | #283 | Tragic 73.2% |
| Kiowa | 0.1 /100 | #284 | Tragic 73.2% |
| Nicaraguans | 0.1 /100 | #285 | Tragic 73.2% |
| Immigrants | Lebanon | 0.1 /100 | #286 | Tragic 73.1% |
| Immigrants | Korea | 0.1 /100 | #287 | Tragic 73.1% |
| Argentineans | 0.1 /100 | #288 | Tragic 73.1% |
| U.S. Virgin Islanders | 0.1 /100 | #289 | Tragic 73.0% |
| Immigrants | Belarus | 0.1 /100 | #290 | Tragic 73.0% |
Demographics Similar to Immigrants from Thailand by In Labor Force | Age 20-24
In terms of in labor force | age 20-24, the demographic groups most similar to Immigrants from Thailand are Immigrants from Iraq (76.4%, a difference of 0.0%), Portuguese (76.4%, a difference of 0.030%), Austrian (76.5%, a difference of 0.050%), Spanish (76.4%, a difference of 0.050%), and Carpatho Rusyn (76.5%, a difference of 0.060%).
| Demographics | Rating | Rank | In Labor Force | Age 20-24 |
| Italians | 99.6 /100 | #80 | Exceptional 76.5% |
| Basques | 99.5 /100 | #81 | Exceptional 76.5% |
| Hmong | 99.5 /100 | #82 | Exceptional 76.5% |
| Carpatho Rusyns | 99.4 /100 | #83 | Exceptional 76.5% |
| Austrians | 99.4 /100 | #84 | Exceptional 76.5% |
| Portuguese | 99.3 /100 | #85 | Exceptional 76.4% |
| Immigrants | Iraq | 99.3 /100 | #86 | Exceptional 76.4% |
| Immigrants | Thailand | 99.3 /100 | #87 | Exceptional 76.4% |
| Spanish | 99.2 /100 | #88 | Exceptional 76.4% |
| Bulgarians | 99.2 /100 | #89 | Exceptional 76.4% |
| Immigrants | Burma/Myanmar | 99.1 /100 | #90 | Exceptional 76.3% |
| Sierra Leoneans | 99.0 /100 | #91 | Exceptional 76.3% |
| Maltese | 98.9 /100 | #92 | Exceptional 76.3% |
| Hungarians | 98.9 /100 | #93 | Exceptional 76.3% |
| Potawatomi | 98.5 /100 | #94 | Exceptional 76.2% |