Immigrants from Albania vs Cuban In Labor Force | Age 30-34
COMPARE
Immigrants from Albania
Cuban
In Labor Force | Age 30-34
In Labor Force | Age 30-34 Comparison
Immigrants from Albania
Cubans
86.1%
IN LABOR FORCE | AGE 30-34
100.0/ 100
METRIC RATING
15th/ 347
METRIC RANK
84.2%
IN LABOR FORCE | AGE 30-34
3.4/ 100
METRIC RATING
224th/ 347
METRIC RANK
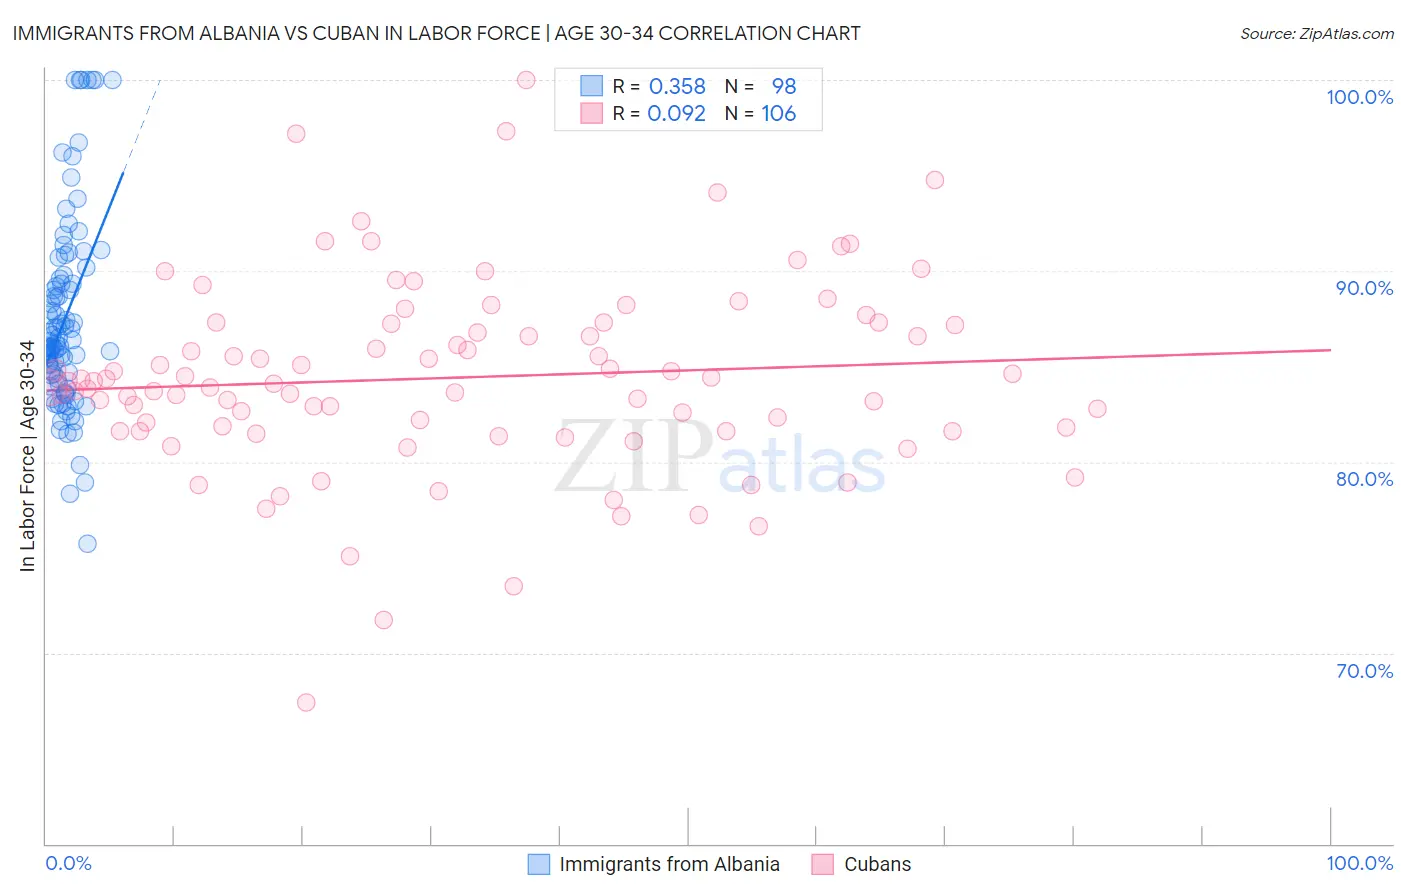
Immigrants from Albania vs Cuban In Labor Force | Age 30-34 Correlation Chart
The statistical analysis conducted on geographies consisting of 119,375,013 people shows a mild positive correlation between the proportion of Immigrants from Albania and labor force participation rate among population between the ages 30 and 34 in the United States with a correlation coefficient (R) of 0.358 and weighted average of 86.1%. Similarly, the statistical analysis conducted on geographies consisting of 448,964,387 people shows a slight positive correlation between the proportion of Cubans and labor force participation rate among population between the ages 30 and 34 in the United States with a correlation coefficient (R) of 0.092 and weighted average of 84.2%, a difference of 2.2%.
In Labor Force | Age 30-34 Correlation Summary
| Measurement | Immigrants from Albania | Cuban |
| Minimum | 75.7% | 67.4% |
| Maximum | 100.0% | 100.0% |
| Range | 24.3% | 32.6% |
| Mean | 87.5% | 84.4% |
| Median | 86.2% | 84.1% |
| Interquartile 25% (IQ1) | 84.3% | 81.6% |
| Interquartile 75% (IQ3) | 89.6% | 87.3% |
| Interquartile Range (IQR) | 5.3% | 5.6% |
| Standard Deviation (Sample) | 5.1% | 5.1% |
| Standard Deviation (Population) | 5.1% | 5.1% |
Similar Demographics by In Labor Force | Age 30-34
Demographics Similar to Immigrants from Albania by In Labor Force | Age 30-34
In terms of in labor force | age 30-34, the demographic groups most similar to Immigrants from Albania are Immigrants from Cabo Verde (86.1%, a difference of 0.010%), Bolivian (86.1%, a difference of 0.030%), Immigrants from Croatia (86.1%, a difference of 0.030%), Latvian (86.0%, a difference of 0.030%), and Immigrants from Cameroon (86.0%, a difference of 0.040%).
| Demographics | Rating | Rank | In Labor Force | Age 30-34 |
| Cambodians | 100.0 /100 | #8 | Exceptional 86.2% |
| Immigrants | Somalia | 100.0 /100 | #9 | Exceptional 86.2% |
| Immigrants | Serbia | 100.0 /100 | #10 | Exceptional 86.2% |
| Carpatho Rusyns | 100.0 /100 | #11 | Exceptional 86.2% |
| Bolivians | 100.0 /100 | #12 | Exceptional 86.1% |
| Immigrants | Croatia | 100.0 /100 | #13 | Exceptional 86.1% |
| Immigrants | Cabo Verde | 100.0 /100 | #14 | Exceptional 86.1% |
| Immigrants | Albania | 100.0 /100 | #15 | Exceptional 86.1% |
| Latvians | 100.0 /100 | #16 | Exceptional 86.0% |
| Immigrants | Cameroon | 100.0 /100 | #17 | Exceptional 86.0% |
| Immigrants | Sierra Leone | 100.0 /100 | #18 | Exceptional 86.0% |
| Sierra Leoneans | 100.0 /100 | #19 | Exceptional 86.0% |
| Bulgarians | 100.0 /100 | #20 | Exceptional 86.0% |
| Immigrants | Bulgaria | 100.0 /100 | #21 | Exceptional 86.0% |
| Bermudans | 100.0 /100 | #22 | Exceptional 85.9% |
Demographics Similar to Cubans by In Labor Force | Age 30-34
In terms of in labor force | age 30-34, the demographic groups most similar to Cubans are Immigrants from Laos (84.2%, a difference of 0.010%), Salvadoran (84.2%, a difference of 0.020%), Panamanian (84.2%, a difference of 0.020%), Scottish (84.2%, a difference of 0.020%), and Immigrants from El Salvador (84.2%, a difference of 0.020%).
| Demographics | Rating | Rank | In Labor Force | Age 30-34 |
| Immigrants | Trinidad and Tobago | 7.0 /100 | #217 | Tragic 84.3% |
| Immigrants | Panama | 6.3 /100 | #218 | Tragic 84.3% |
| Swiss | 5.8 /100 | #219 | Tragic 84.3% |
| Danes | 5.3 /100 | #220 | Tragic 84.3% |
| Salvadorans | 3.8 /100 | #221 | Tragic 84.2% |
| Panamanians | 3.8 /100 | #222 | Tragic 84.2% |
| Immigrants | Laos | 3.6 /100 | #223 | Tragic 84.2% |
| Cubans | 3.4 /100 | #224 | Tragic 84.2% |
| Scottish | 3.1 /100 | #225 | Tragic 84.2% |
| Immigrants | El Salvador | 3.0 /100 | #226 | Tragic 84.2% |
| Immigrants | Cuba | 3.0 /100 | #227 | Tragic 84.2% |
| Immigrants | Haiti | 2.8 /100 | #228 | Tragic 84.2% |
| Welsh | 2.7 /100 | #229 | Tragic 84.2% |
| Immigrants | Bahamas | 2.6 /100 | #230 | Tragic 84.1% |
| Malaysians | 2.2 /100 | #231 | Tragic 84.1% |