Russian vs Immigrants from Barbados In Labor Force | Age 30-34
COMPARE
Russian
Immigrants from Barbados
In Labor Force | Age 30-34
In Labor Force | Age 30-34 Comparison
Russians
Immigrants from Barbados
85.5%
IN LABOR FORCE | AGE 30-34
99.6/ 100
METRIC RATING
57th/ 347
METRIC RANK
84.0%
IN LABOR FORCE | AGE 30-34
1.4/ 100
METRIC RATING
238th/ 347
METRIC RANK
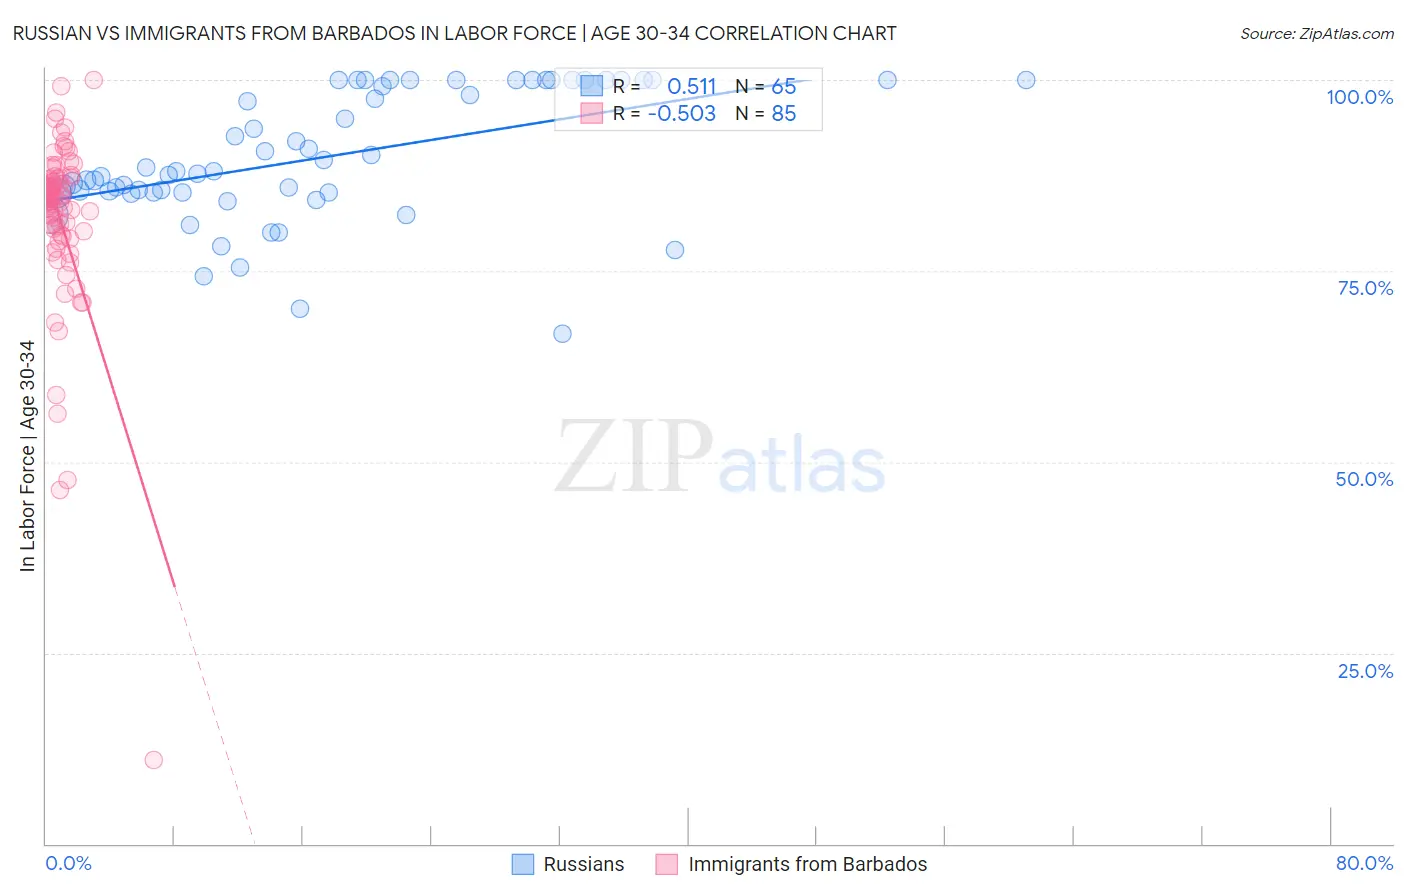
Russian vs Immigrants from Barbados In Labor Force | Age 30-34 Correlation Chart
The statistical analysis conducted on geographies consisting of 511,538,984 people shows a substantial positive correlation between the proportion of Russians and labor force participation rate among population between the ages 30 and 34 in the United States with a correlation coefficient (R) of 0.511 and weighted average of 85.5%. Similarly, the statistical analysis conducted on geographies consisting of 112,774,912 people shows a substantial negative correlation between the proportion of Immigrants from Barbados and labor force participation rate among population between the ages 30 and 34 in the United States with a correlation coefficient (R) of -0.503 and weighted average of 84.0%, a difference of 1.7%.
In Labor Force | Age 30-34 Correlation Summary
| Measurement | Russian | Immigrants from Barbados |
| Minimum | 66.7% | 10.9% |
| Maximum | 100.0% | 100.0% |
| Range | 33.3% | 89.1% |
| Mean | 89.9% | 81.8% |
| Median | 88.0% | 84.6% |
| Interquartile 25% (IQ1) | 85.2% | 79.9% |
| Interquartile 75% (IQ3) | 100.0% | 87.0% |
| Interquartile Range (IQR) | 14.8% | 7.1% |
| Standard Deviation (Sample) | 8.5% | 12.0% |
| Standard Deviation (Population) | 8.4% | 11.9% |
Similar Demographics by In Labor Force | Age 30-34
Demographics Similar to Russians by In Labor Force | Age 30-34
In terms of in labor force | age 30-34, the demographic groups most similar to Russians are Czech (85.5%, a difference of 0.0%), Polish (85.5%, a difference of 0.0%), Immigrants from Kenya (85.5%, a difference of 0.010%), Immigrants from Turkey (85.5%, a difference of 0.010%), and Immigrants from Poland (85.5%, a difference of 0.020%).
| Demographics | Rating | Rank | In Labor Force | Age 30-34 |
| Immigrants | Australia | 99.8 /100 | #50 | Exceptional 85.6% |
| Cape Verdeans | 99.7 /100 | #51 | Exceptional 85.6% |
| Slovenes | 99.7 /100 | #52 | Exceptional 85.6% |
| Filipinos | 99.6 /100 | #53 | Exceptional 85.5% |
| Immigrants | Kenya | 99.6 /100 | #54 | Exceptional 85.5% |
| Immigrants | Turkey | 99.6 /100 | #55 | Exceptional 85.5% |
| Czechs | 99.6 /100 | #56 | Exceptional 85.5% |
| Russians | 99.6 /100 | #57 | Exceptional 85.5% |
| Poles | 99.6 /100 | #58 | Exceptional 85.5% |
| Immigrants | Poland | 99.5 /100 | #59 | Exceptional 85.5% |
| Immigrants | France | 99.5 /100 | #60 | Exceptional 85.5% |
| Immigrants | Brazil | 99.5 /100 | #61 | Exceptional 85.5% |
| Soviet Union | 99.4 /100 | #62 | Exceptional 85.5% |
| Macedonians | 99.4 /100 | #63 | Exceptional 85.5% |
| Italians | 99.4 /100 | #64 | Exceptional 85.4% |
Demographics Similar to Immigrants from Barbados by In Labor Force | Age 30-34
In terms of in labor force | age 30-34, the demographic groups most similar to Immigrants from Barbados are Celtic (84.1%, a difference of 0.0%), English (84.0%, a difference of 0.0%), Venezuelan (84.0%, a difference of 0.010%), U.S. Virgin Islander (84.1%, a difference of 0.020%), and French American Indian (84.1%, a difference of 0.030%).
| Demographics | Rating | Rank | In Labor Force | Age 30-34 |
| Malaysians | 2.2 /100 | #231 | Tragic 84.1% |
| Immigrants | Immigrants | 2.0 /100 | #232 | Tragic 84.1% |
| West Indians | 1.9 /100 | #233 | Tragic 84.1% |
| Haitians | 1.8 /100 | #234 | Tragic 84.1% |
| French American Indians | 1.7 /100 | #235 | Tragic 84.1% |
| U.S. Virgin Islanders | 1.5 /100 | #236 | Tragic 84.1% |
| Celtics | 1.4 /100 | #237 | Tragic 84.1% |
| Immigrants | Barbados | 1.4 /100 | #238 | Tragic 84.0% |
| English | 1.4 /100 | #239 | Tragic 84.0% |
| Venezuelans | 1.3 /100 | #240 | Tragic 84.0% |
| Immigrants | Portugal | 1.2 /100 | #241 | Tragic 84.0% |
| Immigrants | Oceania | 1.1 /100 | #242 | Tragic 84.0% |
| Immigrants | Caribbean | 1.1 /100 | #243 | Tragic 84.0% |
| Basques | 0.9 /100 | #244 | Tragic 84.0% |
| Immigrants | Venezuela | 0.9 /100 | #245 | Tragic 84.0% |