Ecuadorian vs Cree In Labor Force | Age 16-19
COMPARE
Ecuadorian
Cree
In Labor Force | Age 16-19
In Labor Force | Age 16-19 Comparison
Ecuadorians
Cree
31.4%
IN LABOR FORCE | AGE 16-19
0.0/ 100
METRIC RATING
320th/ 347
METRIC RANK
40.8%
IN LABOR FORCE | AGE 16-19
100.0/ 100
METRIC RATING
49th/ 347
METRIC RANK
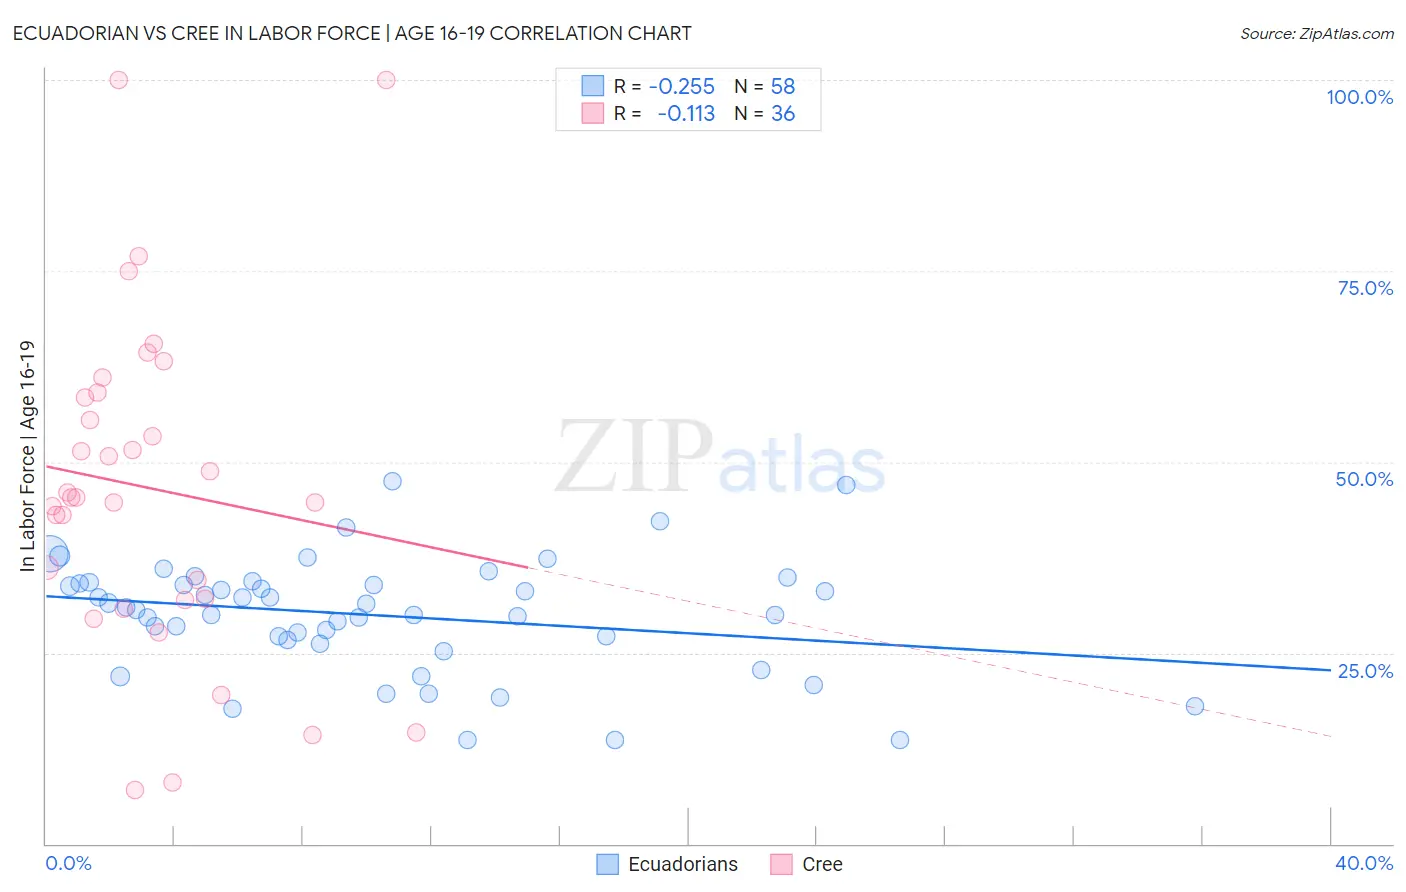
Ecuadorian vs Cree In Labor Force | Age 16-19 Correlation Chart
The statistical analysis conducted on geographies consisting of 317,507,621 people shows a weak negative correlation between the proportion of Ecuadorians and labor force participation rate among population between the ages 16 and 19 in the United States with a correlation coefficient (R) of -0.255 and weighted average of 31.4%. Similarly, the statistical analysis conducted on geographies consisting of 76,173,738 people shows a poor negative correlation between the proportion of Cree and labor force participation rate among population between the ages 16 and 19 in the United States with a correlation coefficient (R) of -0.113 and weighted average of 40.8%, a difference of 29.9%.
In Labor Force | Age 16-19 Correlation Summary
| Measurement | Ecuadorian | Cree |
| Minimum | 13.6% | 7.1% |
| Maximum | 47.4% | 100.0% |
| Range | 33.8% | 92.9% |
| Mean | 29.9% | 46.6% |
| Median | 30.8% | 45.4% |
| Interquartile 25% (IQ1) | 26.7% | 32.0% |
| Interquartile 75% (IQ3) | 34.0% | 58.8% |
| Interquartile Range (IQR) | 7.3% | 26.8% |
| Standard Deviation (Sample) | 7.4% | 21.8% |
| Standard Deviation (Population) | 7.4% | 21.4% |
Similar Demographics by In Labor Force | Age 16-19
Demographics Similar to Ecuadorians by In Labor Force | Age 16-19
In terms of in labor force | age 16-19, the demographic groups most similar to Ecuadorians are Soviet Union (31.4%, a difference of 0.060%), West Indian (31.3%, a difference of 0.23%), Tohono O'odham (31.3%, a difference of 0.35%), Immigrants from Yemen (31.5%, a difference of 0.38%), and Immigrants from Caribbean (31.2%, a difference of 0.48%).
| Demographics | Rating | Rank | In Labor Force | Age 16-19 |
| Hopi | 0.0 /100 | #313 | Tragic 31.8% |
| Cubans | 0.0 /100 | #314 | Tragic 31.8% |
| Immigrants | West Indies | 0.0 /100 | #315 | Tragic 31.7% |
| Filipinos | 0.0 /100 | #316 | Tragic 31.7% |
| Immigrants | Nicaragua | 0.0 /100 | #317 | Tragic 31.6% |
| Immigrants | Yemen | 0.0 /100 | #318 | Tragic 31.5% |
| Soviet Union | 0.0 /100 | #319 | Tragic 31.4% |
| Ecuadorians | 0.0 /100 | #320 | Tragic 31.4% |
| West Indians | 0.0 /100 | #321 | Tragic 31.3% |
| Tohono O'odham | 0.0 /100 | #322 | Tragic 31.3% |
| Immigrants | Caribbean | 0.0 /100 | #323 | Tragic 31.2% |
| Dominicans | 0.0 /100 | #324 | Tragic 31.2% |
| Immigrants | China | 0.0 /100 | #325 | Tragic 31.1% |
| Immigrants | Dominican Republic | 0.0 /100 | #326 | Tragic 31.1% |
| Immigrants | Taiwan | 0.0 /100 | #327 | Tragic 31.0% |
Demographics Similar to Cree by In Labor Force | Age 16-19
In terms of in labor force | age 16-19, the demographic groups most similar to Cree are Icelander (40.8%, a difference of 0.020%), Carpatho Rusyn (40.8%, a difference of 0.070%), Indonesian (40.7%, a difference of 0.16%), Immigrants from Zaire (40.7%, a difference of 0.26%), and Immigrants from Laos (40.6%, a difference of 0.34%).
| Demographics | Rating | Rank | In Labor Force | Age 16-19 |
| Whites/Caucasians | 100.0 /100 | #42 | Exceptional 41.3% |
| Tongans | 100.0 /100 | #43 | Exceptional 41.2% |
| Europeans | 100.0 /100 | #44 | Exceptional 41.1% |
| Croatians | 100.0 /100 | #45 | Exceptional 41.1% |
| Immigrants | Sudan | 100.0 /100 | #46 | Exceptional 41.0% |
| Carpatho Rusyns | 100.0 /100 | #47 | Exceptional 40.8% |
| Icelanders | 100.0 /100 | #48 | Exceptional 40.8% |
| Cree | 100.0 /100 | #49 | Exceptional 40.8% |
| Indonesians | 100.0 /100 | #50 | Exceptional 40.7% |
| Immigrants | Zaire | 100.0 /100 | #51 | Exceptional 40.7% |
| Immigrants | Laos | 100.0 /100 | #52 | Exceptional 40.6% |
| Immigrants | Kenya | 100.0 /100 | #53 | Exceptional 40.5% |
| Tlingit-Haida | 100.0 /100 | #54 | Exceptional 40.5% |
| British | 100.0 /100 | #55 | Exceptional 40.5% |
| Fijians | 100.0 /100 | #56 | Exceptional 40.4% |