Hungarian vs Immigrants from England Vision Disability
COMPARE
Hungarian
Immigrants from England
Vision Disability
Vision Disability Comparison
Hungarians
Immigrants from England
2.1%
VISION DISABILITY
67.4/ 100
METRIC RATING
162nd/ 347
METRIC RANK
2.1%
VISION DISABILITY
62.8/ 100
METRIC RATING
166th/ 347
METRIC RANK
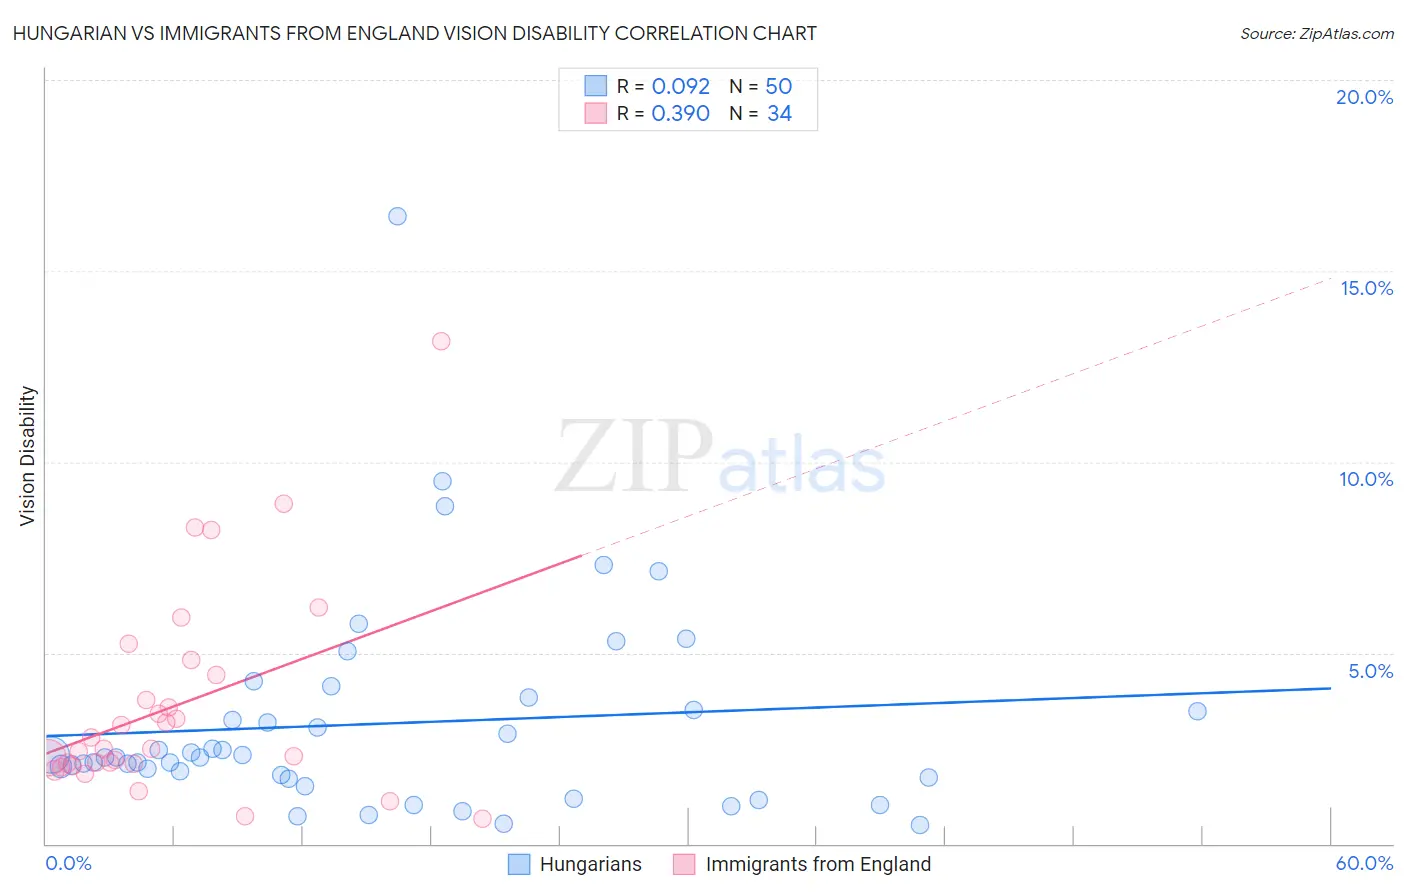
Hungarian vs Immigrants from England Vision Disability Correlation Chart
The statistical analysis conducted on geographies consisting of 485,432,648 people shows a slight positive correlation between the proportion of Hungarians and percentage of population with vision disability in the United States with a correlation coefficient (R) of 0.092 and weighted average of 2.1%. Similarly, the statistical analysis conducted on geographies consisting of 391,606,709 people shows a mild positive correlation between the proportion of Immigrants from England and percentage of population with vision disability in the United States with a correlation coefficient (R) of 0.390 and weighted average of 2.1%, a difference of 0.32%.
Vision Disability Correlation Summary
| Measurement | Hungarian | Immigrants from England |
| Minimum | 0.49% | 0.66% |
| Maximum | 16.4% | 13.2% |
| Range | 15.9% | 12.5% |
| Mean | 3.1% | 3.6% |
| Median | 2.3% | 2.5% |
| Interquartile 25% (IQ1) | 1.7% | 2.1% |
| Interquartile 75% (IQ3) | 3.5% | 4.4% |
| Interquartile Range (IQR) | 1.8% | 2.3% |
| Standard Deviation (Sample) | 2.8% | 2.7% |
| Standard Deviation (Population) | 2.8% | 2.6% |
Demographics Similar to Hungarians and Immigrants from England by Vision Disability
In terms of vision disability, the demographic groups most similar to Hungarians are Iraqi (2.1%, a difference of 0.030%), Icelander (2.1%, a difference of 0.090%), Austrian (2.1%, a difference of 0.12%), Immigrants from Bangladesh (2.1%, a difference of 0.13%), and South African (2.1%, a difference of 0.18%). Similarly, the demographic groups most similar to Immigrants from England are Immigrants from Africa (2.1%, a difference of 0.010%), Brazilian (2.1%, a difference of 0.040%), Immigrants from Iraq (2.1%, a difference of 0.14%), Immigrants from Bangladesh (2.1%, a difference of 0.19%), and Icelander (2.1%, a difference of 0.23%).
| Demographics | Rating | Rank | Vision Disability |
| Slovenes | 73.6 /100 | #154 | Good 2.1% |
| Immigrants | Colombia | 72.1 /100 | #155 | Good 2.1% |
| Pakistanis | 71.6 /100 | #156 | Good 2.1% |
| Serbians | 70.2 /100 | #157 | Good 2.1% |
| Immigrants | Uzbekistan | 69.9 /100 | #158 | Good 2.1% |
| South Africans | 69.8 /100 | #159 | Good 2.1% |
| Austrians | 69.0 /100 | #160 | Good 2.1% |
| Iraqis | 67.7 /100 | #161 | Good 2.1% |
| Hungarians | 67.4 /100 | #162 | Good 2.1% |
| Icelanders | 66.1 /100 | #163 | Good 2.1% |
| Immigrants | Bangladesh | 65.5 /100 | #164 | Good 2.1% |
| Immigrants | Iraq | 64.8 /100 | #165 | Good 2.1% |
| Immigrants | England | 62.8 /100 | #166 | Good 2.1% |
| Immigrants | Africa | 62.6 /100 | #167 | Good 2.1% |
| Brazilians | 62.2 /100 | #168 | Good 2.1% |
| South American Indians | 57.4 /100 | #169 | Average 2.2% |
| Swiss | 55.7 /100 | #170 | Average 2.2% |
| Lebanese | 54.3 /100 | #171 | Average 2.2% |
| Northern Europeans | 50.1 /100 | #172 | Average 2.2% |
| Scandinavians | 50.0 /100 | #173 | Average 2.2% |
| Immigrants | Canada | 50.0 /100 | #174 | Average 2.2% |