British vs Immigrants from Uzbekistan In Labor Force | Age > 16
COMPARE
British
Immigrants from Uzbekistan
In Labor Force | Age > 16
In Labor Force | Age > 16 Comparison
British
Immigrants from Uzbekistan
64.7%
IN LABOR FORCE | AGE > 16
7.3/ 100
METRIC RATING
229th/ 347
METRIC RANK
64.3%
IN LABOR FORCE | AGE > 16
1.4/ 100
METRIC RATING
254th/ 347
METRIC RANK
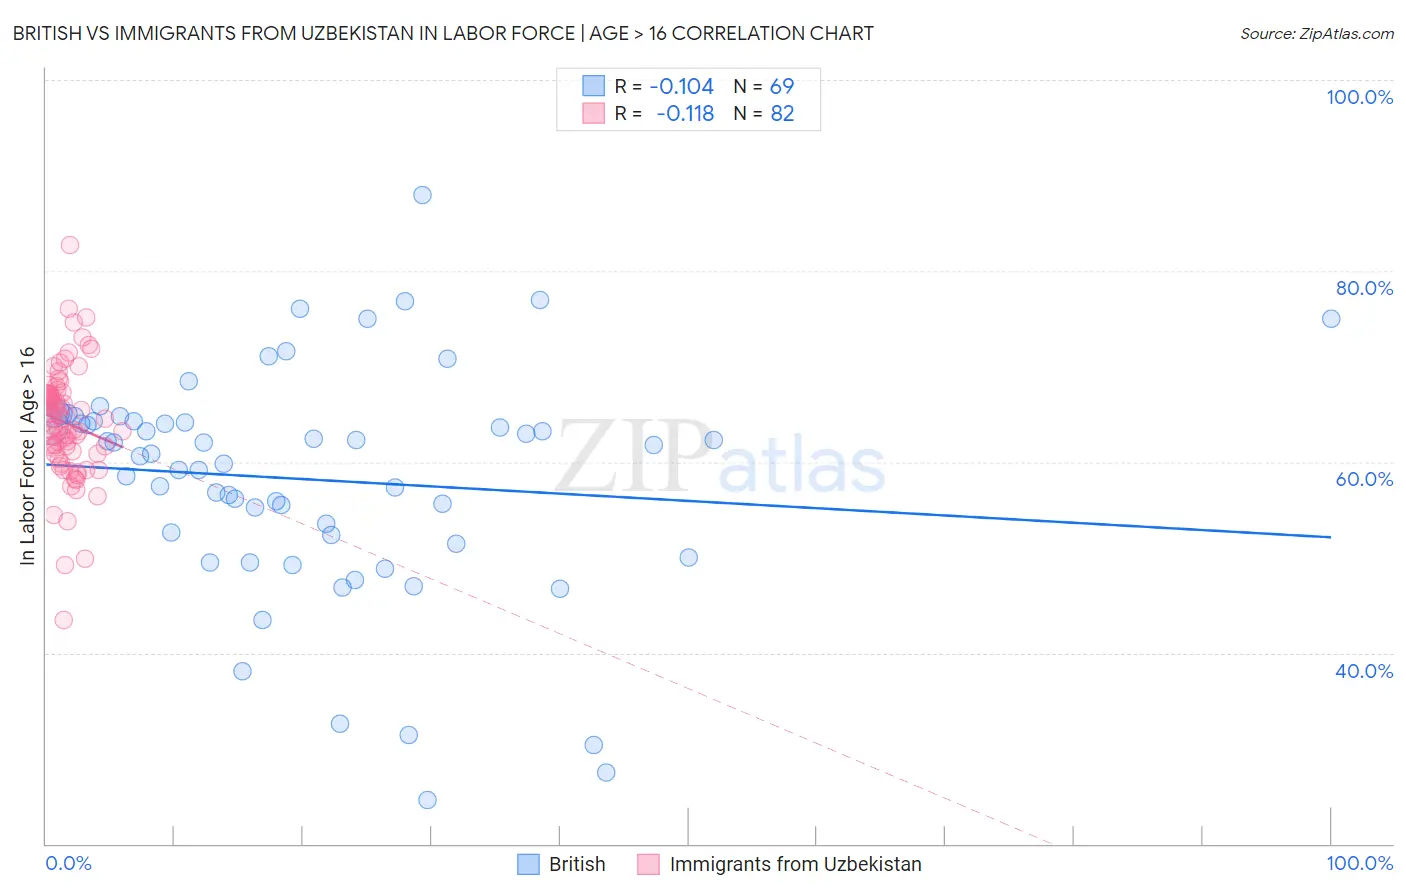
British vs Immigrants from Uzbekistan In Labor Force | Age > 16 Correlation Chart
The statistical analysis conducted on geographies consisting of 531,501,445 people shows a poor negative correlation between the proportion of British and labor force participation rate among population ages 16 and over in the United States with a correlation coefficient (R) of -0.104 and weighted average of 64.7%. Similarly, the statistical analysis conducted on geographies consisting of 118,764,093 people shows a poor negative correlation between the proportion of Immigrants from Uzbekistan and labor force participation rate among population ages 16 and over in the United States with a correlation coefficient (R) of -0.118 and weighted average of 64.3%, a difference of 0.48%.
In Labor Force | Age > 16 Correlation Summary
| Measurement | British | Immigrants from Uzbekistan |
| Minimum | 24.6% | 43.5% |
| Maximum | 87.9% | 82.7% |
| Range | 63.3% | 39.2% |
| Mean | 58.2% | 64.1% |
| Median | 60.9% | 64.5% |
| Interquartile 25% (IQ1) | 51.9% | 60.9% |
| Interquartile 75% (IQ3) | 64.3% | 67.1% |
| Interquartile Range (IQR) | 12.5% | 6.2% |
| Standard Deviation (Sample) | 12.0% | 6.0% |
| Standard Deviation (Population) | 11.9% | 6.0% |
Similar Demographics by In Labor Force | Age > 16
Demographics Similar to British by In Labor Force | Age > 16
In terms of in labor force | age > 16, the demographic groups most similar to British are Chinese (64.7%, a difference of 0.0%), Immigrants from Northern Europe (64.7%, a difference of 0.0%), European (64.7%, a difference of 0.040%), Polish (64.7%, a difference of 0.040%), and Northern European (64.7%, a difference of 0.040%).
| Demographics | Rating | Rank | In Labor Force | Age > 16 |
| Hawaiians | 9.3 /100 | #222 | Tragic 64.7% |
| Immigrants | Belize | 9.2 /100 | #223 | Tragic 64.7% |
| Immigrants | Jamaica | 8.8 /100 | #224 | Tragic 64.7% |
| Croatians | 8.8 /100 | #225 | Tragic 64.7% |
| Europeans | 8.3 /100 | #226 | Tragic 64.7% |
| Poles | 8.3 /100 | #227 | Tragic 64.7% |
| Northern Europeans | 8.2 /100 | #228 | Tragic 64.7% |
| British | 7.3 /100 | #229 | Tragic 64.7% |
| Chinese | 7.3 /100 | #230 | Tragic 64.7% |
| Immigrants | Northern Europe | 7.2 /100 | #231 | Tragic 64.7% |
| Africans | 5.8 /100 | #232 | Tragic 64.6% |
| Slavs | 4.9 /100 | #233 | Tragic 64.6% |
| Vietnamese | 4.7 /100 | #234 | Tragic 64.6% |
| Austrians | 4.6 /100 | #235 | Tragic 64.6% |
| Immigrants | Norway | 4.6 /100 | #236 | Tragic 64.6% |
Demographics Similar to Immigrants from Uzbekistan by In Labor Force | Age > 16
In terms of in labor force | age > 16, the demographic groups most similar to Immigrants from Uzbekistan are Czechoslovakian (64.3%, a difference of 0.0%), Immigrants from Dominican Republic (64.4%, a difference of 0.010%), Portuguese (64.4%, a difference of 0.040%), British West Indian (64.4%, a difference of 0.060%), and German (64.4%, a difference of 0.070%).
| Demographics | Rating | Rank | In Labor Force | Age > 16 |
| Swiss | 2.1 /100 | #247 | Tragic 64.4% |
| Immigrants | Barbados | 2.1 /100 | #248 | Tragic 64.4% |
| Germans | 1.8 /100 | #249 | Tragic 64.4% |
| British West Indians | 1.8 /100 | #250 | Tragic 64.4% |
| Portuguese | 1.6 /100 | #251 | Tragic 64.4% |
| Immigrants | Dominican Republic | 1.5 /100 | #252 | Tragic 64.4% |
| Czechoslovakians | 1.4 /100 | #253 | Tragic 64.3% |
| Immigrants | Uzbekistan | 1.4 /100 | #254 | Tragic 64.3% |
| Hispanics or Latinos | 1.1 /100 | #255 | Tragic 64.3% |
| Immigrants | Mexico | 1.0 /100 | #256 | Tragic 64.3% |
| Inupiat | 0.8 /100 | #257 | Tragic 64.3% |
| Immigrants | Scotland | 0.8 /100 | #258 | Tragic 64.2% |
| Immigrants | Western Europe | 0.7 /100 | #259 | Tragic 64.2% |
| Marshallese | 0.7 /100 | #260 | Tragic 64.2% |
| Basques | 0.7 /100 | #261 | Tragic 64.2% |