Chippewa vs Pennsylvania German In Labor Force | Age 45-54
COMPARE
Chippewa
Pennsylvania German
In Labor Force | Age 45-54
In Labor Force | Age 45-54 Comparison
Chippewa
Pennsylvania Germans
81.3%
IN LABOR FORCE | AGE 45-54
0.0/ 100
METRIC RATING
273rd/ 347
METRIC RANK
81.6%
IN LABOR FORCE | AGE 45-54
0.2/ 100
METRIC RATING
252nd/ 347
METRIC RANK
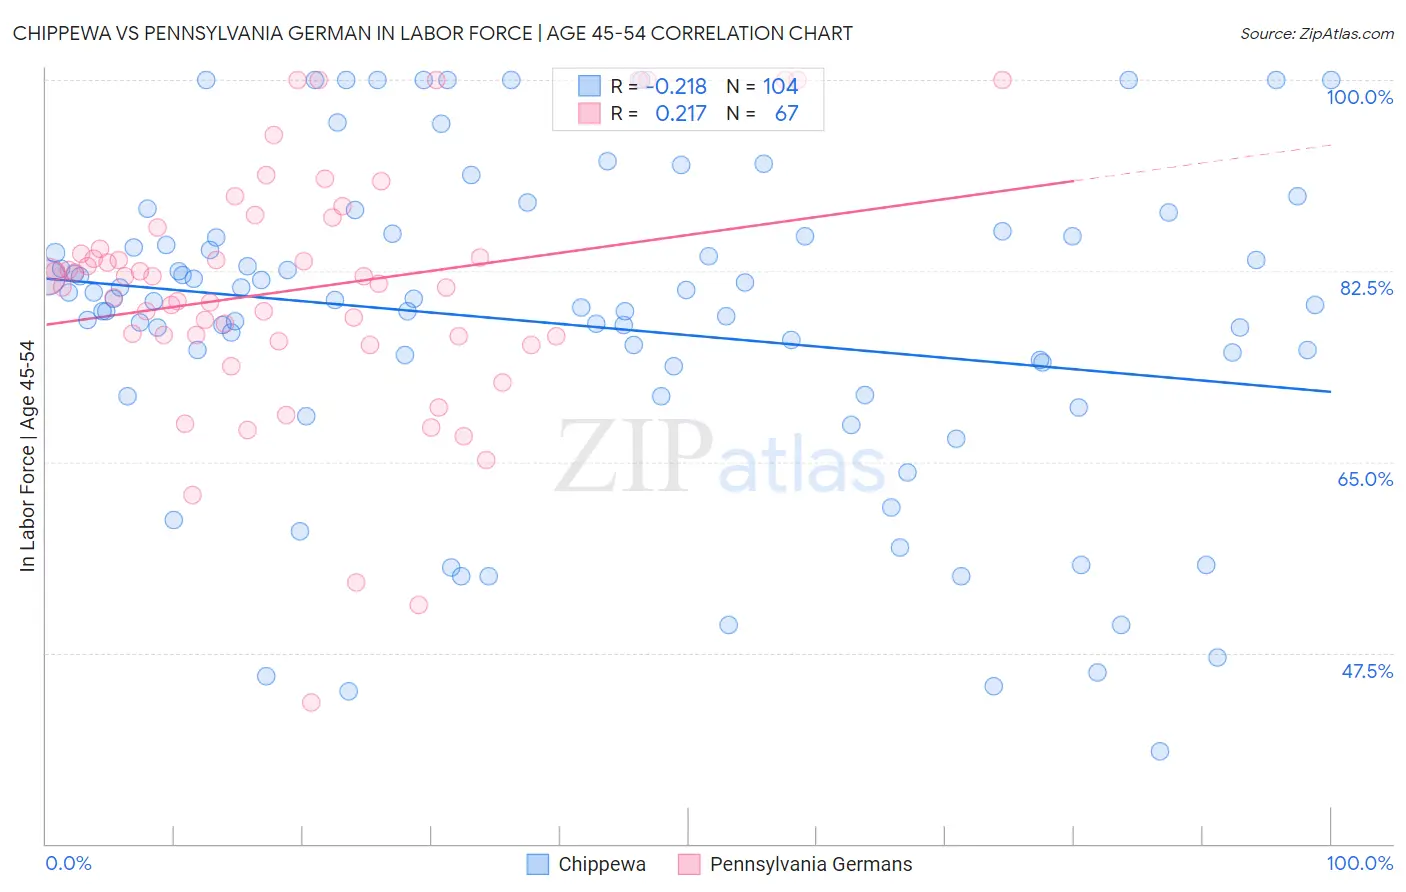
Chippewa vs Pennsylvania German In Labor Force | Age 45-54 Correlation Chart
The statistical analysis conducted on geographies consisting of 214,988,239 people shows a weak negative correlation between the proportion of Chippewa and labor force participation rate among population between the ages 45 and 54 in the United States with a correlation coefficient (R) of -0.218 and weighted average of 81.3%. Similarly, the statistical analysis conducted on geographies consisting of 234,049,036 people shows a weak positive correlation between the proportion of Pennsylvania Germans and labor force participation rate among population between the ages 45 and 54 in the United States with a correlation coefficient (R) of 0.217 and weighted average of 81.6%, a difference of 0.46%.
In Labor Force | Age 45-54 Correlation Summary
| Measurement | Chippewa | Pennsylvania German |
| Minimum | 38.5% | 42.9% |
| Maximum | 100.0% | 100.0% |
| Range | 61.5% | 57.1% |
| Mean | 77.6% | 80.8% |
| Median | 79.8% | 82.0% |
| Interquartile 25% (IQ1) | 72.5% | 76.5% |
| Interquartile 75% (IQ3) | 85.6% | 86.5% |
| Interquartile Range (IQR) | 13.2% | 10.0% |
| Standard Deviation (Sample) | 14.6% | 11.4% |
| Standard Deviation (Population) | 14.5% | 11.3% |
Similar Demographics by In Labor Force | Age 45-54
Demographics Similar to Chippewa by In Labor Force | Age 45-54
In terms of in labor force | age 45-54, the demographic groups most similar to Chippewa are British West Indian (81.2%, a difference of 0.030%), Nonimmigrants (81.2%, a difference of 0.040%), Spanish (81.3%, a difference of 0.060%), Bangladeshi (81.3%, a difference of 0.070%), and Immigrants from Barbados (81.3%, a difference of 0.070%).
| Demographics | Rating | Rank | In Labor Force | Age 45-54 |
| Immigrants | St. Vincent and the Grenadines | 0.1 /100 | #266 | Tragic 81.4% |
| West Indians | 0.1 /100 | #267 | Tragic 81.4% |
| Immigrants | Honduras | 0.0 /100 | #268 | Tragic 81.4% |
| Alsatians | 0.0 /100 | #269 | Tragic 81.3% |
| Bangladeshis | 0.0 /100 | #270 | Tragic 81.3% |
| Immigrants | Barbados | 0.0 /100 | #271 | Tragic 81.3% |
| Spanish | 0.0 /100 | #272 | Tragic 81.3% |
| Chippewa | 0.0 /100 | #273 | Tragic 81.3% |
| British West Indians | 0.0 /100 | #274 | Tragic 81.2% |
| Immigrants | Nonimmigrants | 0.0 /100 | #275 | Tragic 81.2% |
| U.S. Virgin Islanders | 0.0 /100 | #276 | Tragic 81.2% |
| Guatemalans | 0.0 /100 | #277 | Tragic 81.2% |
| Immigrants | Guatemala | 0.0 /100 | #278 | Tragic 81.1% |
| Immigrants | Micronesia | 0.0 /100 | #279 | Tragic 81.1% |
| Immigrants | Latin America | 0.0 /100 | #280 | Tragic 81.0% |
Demographics Similar to Pennsylvania Germans by In Labor Force | Age 45-54
In terms of in labor force | age 45-54, the demographic groups most similar to Pennsylvania Germans are Guamanian/Chamorro (81.6%, a difference of 0.020%), Japanese (81.6%, a difference of 0.030%), Immigrants from Laos (81.6%, a difference of 0.030%), Immigrants from Armenia (81.7%, a difference of 0.040%), and Scotch-Irish (81.6%, a difference of 0.050%).
| Demographics | Rating | Rank | In Labor Force | Age 45-54 |
| Alaska Natives | 0.4 /100 | #245 | Tragic 81.8% |
| Alaskan Athabascans | 0.4 /100 | #246 | Tragic 81.8% |
| Central Americans | 0.4 /100 | #247 | Tragic 81.7% |
| Puget Sound Salish | 0.3 /100 | #248 | Tragic 81.7% |
| Hmong | 0.3 /100 | #249 | Tragic 81.7% |
| Immigrants | Armenia | 0.2 /100 | #250 | Tragic 81.7% |
| Guamanians/Chamorros | 0.2 /100 | #251 | Tragic 81.6% |
| Pennsylvania Germans | 0.2 /100 | #252 | Tragic 81.6% |
| Japanese | 0.2 /100 | #253 | Tragic 81.6% |
| Immigrants | Laos | 0.2 /100 | #254 | Tragic 81.6% |
| Scotch-Irish | 0.2 /100 | #255 | Tragic 81.6% |
| Barbadians | 0.1 /100 | #256 | Tragic 81.6% |
| Immigrants | Congo | 0.1 /100 | #257 | Tragic 81.6% |
| Immigrants | Fiji | 0.1 /100 | #258 | Tragic 81.5% |
| Guyanese | 0.1 /100 | #259 | Tragic 81.5% |