Ghanaian vs Spanish American Indian In Labor Force | Age 20-64
COMPARE
Ghanaian
Spanish American Indian
In Labor Force | Age 20-64
In Labor Force | Age 20-64 Comparison
Ghanaians
Spanish American Indians
80.1%
IN LABOR FORCE | AGE 20-64
96.7/ 100
METRIC RATING
92nd/ 347
METRIC RANK
77.6%
IN LABOR FORCE | AGE 20-64
0.0/ 100
METRIC RATING
300th/ 347
METRIC RANK
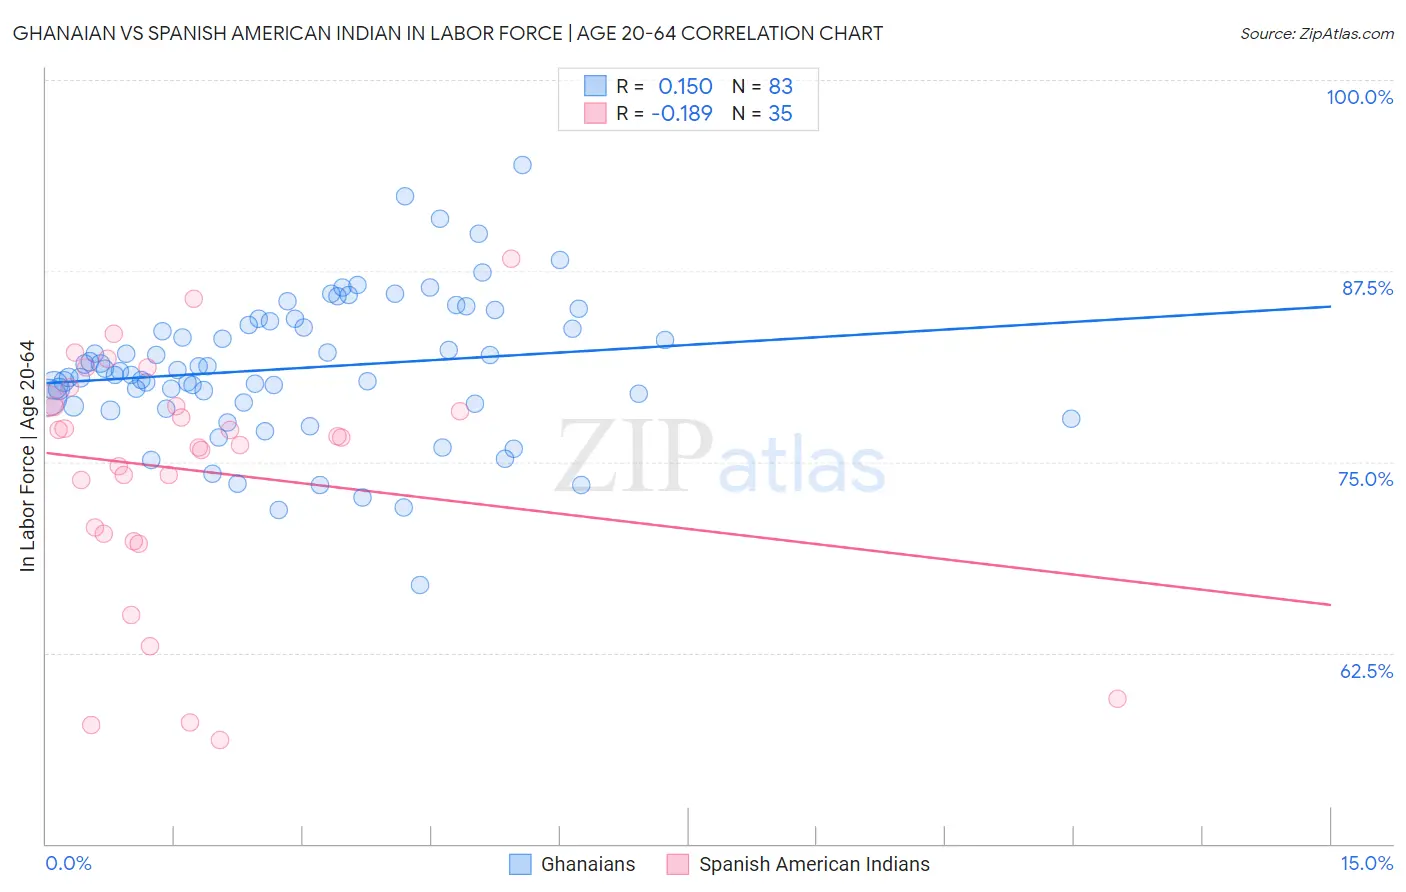
Ghanaian vs Spanish American Indian In Labor Force | Age 20-64 Correlation Chart
The statistical analysis conducted on geographies consisting of 190,721,874 people shows a poor positive correlation between the proportion of Ghanaians and labor force participation rate among population between the ages 20 and 64 in the United States with a correlation coefficient (R) of 0.150 and weighted average of 80.1%. Similarly, the statistical analysis conducted on geographies consisting of 73,150,359 people shows a poor negative correlation between the proportion of Spanish American Indians and labor force participation rate among population between the ages 20 and 64 in the United States with a correlation coefficient (R) of -0.189 and weighted average of 77.6%, a difference of 3.3%.
In Labor Force | Age 20-64 Correlation Summary
| Measurement | Ghanaian | Spanish American Indian |
| Minimum | 66.9% | 56.8% |
| Maximum | 94.4% | 88.3% |
| Range | 27.5% | 31.5% |
| Mean | 81.1% | 74.4% |
| Median | 80.9% | 76.6% |
| Interquartile 25% (IQ1) | 78.8% | 70.3% |
| Interquartile 75% (IQ3) | 84.2% | 79.0% |
| Interquartile Range (IQR) | 5.4% | 8.7% |
| Standard Deviation (Sample) | 4.7% | 7.9% |
| Standard Deviation (Population) | 4.7% | 7.8% |
Similar Demographics by In Labor Force | Age 20-64
Demographics Similar to Ghanaians by In Labor Force | Age 20-64
In terms of in labor force | age 20-64, the demographic groups most similar to Ghanaians are Uruguayan (80.1%, a difference of 0.0%), Immigrants from Venezuela (80.1%, a difference of 0.010%), Polish (80.1%, a difference of 0.010%), Chilean (80.1%, a difference of 0.020%), and Immigrants from Belarus (80.1%, a difference of 0.020%).
| Demographics | Rating | Rank | In Labor Force | Age 20-64 |
| Jordanians | 97.2 /100 | #85 | Exceptional 80.1% |
| Immigrants | Egypt | 97.1 /100 | #86 | Exceptional 80.1% |
| Croatians | 97.1 /100 | #87 | Exceptional 80.1% |
| Chileans | 97.0 /100 | #88 | Exceptional 80.1% |
| Immigrants | Venezuela | 96.8 /100 | #89 | Exceptional 80.1% |
| Poles | 96.8 /100 | #90 | Exceptional 80.1% |
| Uruguayans | 96.7 /100 | #91 | Exceptional 80.1% |
| Ghanaians | 96.7 /100 | #92 | Exceptional 80.1% |
| Immigrants | Belarus | 96.4 /100 | #93 | Exceptional 80.1% |
| Immigrants | Asia | 96.0 /100 | #94 | Exceptional 80.1% |
| Yugoslavians | 95.9 /100 | #95 | Exceptional 80.1% |
| Immigrants | Malaysia | 95.9 /100 | #96 | Exceptional 80.1% |
| South Americans | 95.9 /100 | #97 | Exceptional 80.1% |
| Immigrants | Uruguay | 95.8 /100 | #98 | Exceptional 80.1% |
| Immigrants | Chile | 95.7 /100 | #99 | Exceptional 80.1% |
Demographics Similar to Spanish American Indians by In Labor Force | Age 20-64
In terms of in labor force | age 20-64, the demographic groups most similar to Spanish American Indians are Nepalese (77.5%, a difference of 0.040%), Hispanic or Latino (77.6%, a difference of 0.070%), Iroquois (77.5%, a difference of 0.090%), Dominican (77.7%, a difference of 0.13%), and Cree (77.7%, a difference of 0.13%).
| Demographics | Rating | Rank | In Labor Force | Age 20-64 |
| Delaware | 0.0 /100 | #293 | Tragic 77.8% |
| Immigrants | Central America | 0.0 /100 | #294 | Tragic 77.7% |
| Immigrants | Grenada | 0.0 /100 | #295 | Tragic 77.7% |
| Immigrants | Dominican Republic | 0.0 /100 | #296 | Tragic 77.7% |
| Dominicans | 0.0 /100 | #297 | Tragic 77.7% |
| Cree | 0.0 /100 | #298 | Tragic 77.7% |
| Hispanics or Latinos | 0.0 /100 | #299 | Tragic 77.6% |
| Spanish American Indians | 0.0 /100 | #300 | Tragic 77.6% |
| Nepalese | 0.0 /100 | #301 | Tragic 77.5% |
| Iroquois | 0.0 /100 | #302 | Tragic 77.5% |
| Chippewa | 0.0 /100 | #303 | Tragic 77.3% |
| Immigrants | Mexico | 0.0 /100 | #304 | Tragic 77.3% |
| Mexicans | 0.0 /100 | #305 | Tragic 77.2% |
| Potawatomi | 0.0 /100 | #306 | Tragic 77.2% |
| Central American Indians | 0.0 /100 | #307 | Tragic 77.1% |