Ghanaian vs Immigrants from Eastern Asia In Labor Force | Age 25-29
COMPARE
Ghanaian
Immigrants from Eastern Asia
In Labor Force | Age 25-29
In Labor Force | Age 25-29 Comparison
Ghanaians
Immigrants from Eastern Asia
84.7%
IN LABOR FORCE | AGE 25-29
57.6/ 100
METRIC RATING
164th/ 347
METRIC RANK
84.8%
IN LABOR FORCE | AGE 25-29
72.6/ 100
METRIC RATING
139th/ 347
METRIC RANK
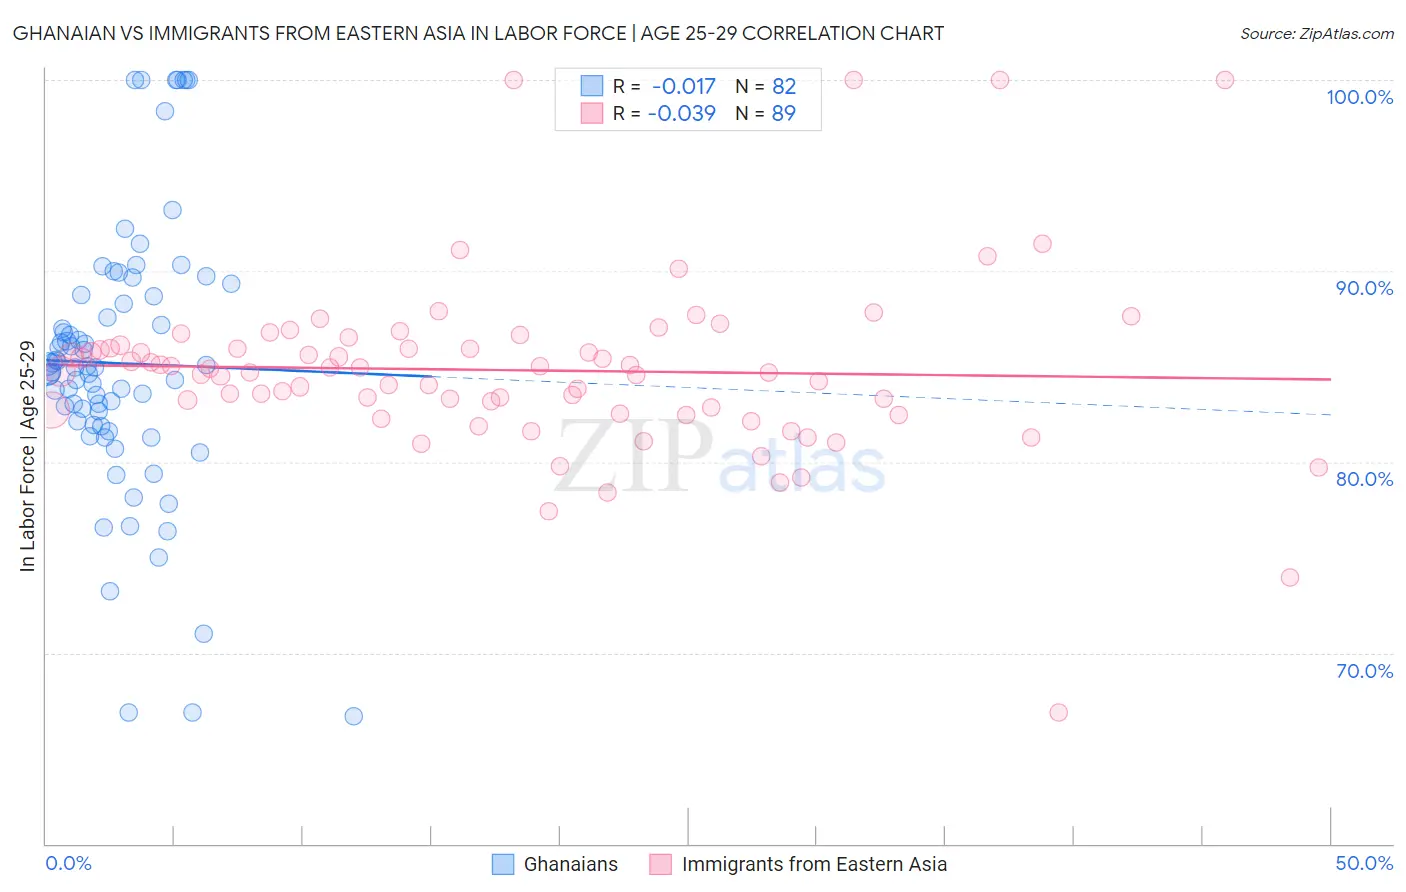
Ghanaian vs Immigrants from Eastern Asia In Labor Force | Age 25-29 Correlation Chart
The statistical analysis conducted on geographies consisting of 190,676,987 people shows no correlation between the proportion of Ghanaians and labor force participation rate among population between the ages 25 and 29 in the United States with a correlation coefficient (R) of -0.017 and weighted average of 84.7%. Similarly, the statistical analysis conducted on geographies consisting of 499,536,378 people shows no correlation between the proportion of Immigrants from Eastern Asia and labor force participation rate among population between the ages 25 and 29 in the United States with a correlation coefficient (R) of -0.039 and weighted average of 84.8%, a difference of 0.12%.
In Labor Force | Age 25-29 Correlation Summary
| Measurement | Ghanaian | Immigrants from Eastern Asia |
| Minimum | 66.7% | 66.9% |
| Maximum | 100.0% | 100.0% |
| Range | 33.3% | 33.1% |
| Mean | 85.2% | 84.8% |
| Median | 84.9% | 84.7% |
| Interquartile 25% (IQ1) | 81.9% | 82.6% |
| Interquartile 75% (IQ3) | 88.7% | 86.0% |
| Interquartile Range (IQR) | 6.8% | 3.4% |
| Standard Deviation (Sample) | 7.1% | 4.8% |
| Standard Deviation (Population) | 7.1% | 4.7% |
Similar Demographics by In Labor Force | Age 25-29
Demographics Similar to Ghanaians by In Labor Force | Age 25-29
In terms of in labor force | age 25-29, the demographic groups most similar to Ghanaians are Immigrants from Colombia (84.7%, a difference of 0.0%), Argentinean (84.7%, a difference of 0.0%), Immigrants from Burma/Myanmar (84.7%, a difference of 0.0%), Immigrants from Peru (84.7%, a difference of 0.010%), and Canadian (84.7%, a difference of 0.010%).
| Demographics | Rating | Rank | In Labor Force | Age 25-29 |
| British | 60.4 /100 | #157 | Good 84.7% |
| Immigrants | Ghana | 60.2 /100 | #158 | Good 84.7% |
| Immigrants | Western Africa | 60.1 /100 | #159 | Good 84.7% |
| Immigrants | Peru | 58.6 /100 | #160 | Average 84.7% |
| Canadians | 58.5 /100 | #161 | Average 84.7% |
| Immigrants | Colombia | 58.3 /100 | #162 | Average 84.7% |
| Argentineans | 57.9 /100 | #163 | Average 84.7% |
| Ghanaians | 57.6 /100 | #164 | Average 84.7% |
| Immigrants | Burma/Myanmar | 57.4 /100 | #165 | Average 84.7% |
| Immigrants | Spain | 56.9 /100 | #166 | Average 84.7% |
| Indonesians | 56.5 /100 | #167 | Average 84.7% |
| South Americans | 54.9 /100 | #168 | Average 84.7% |
| Celtics | 52.5 /100 | #169 | Average 84.7% |
| Tongans | 52.4 /100 | #170 | Average 84.7% |
| Immigrants | Vietnam | 50.5 /100 | #171 | Average 84.7% |
Demographics Similar to Immigrants from Eastern Asia by In Labor Force | Age 25-29
In terms of in labor force | age 25-29, the demographic groups most similar to Immigrants from Eastern Asia are Armenian (84.8%, a difference of 0.0%), Immigrants from North America (84.8%, a difference of 0.0%), Immigrants from Canada (84.8%, a difference of 0.010%), Danish (84.8%, a difference of 0.010%), and Pakistani (84.8%, a difference of 0.020%).
| Demographics | Rating | Rank | In Labor Force | Age 25-29 |
| Romanians | 77.7 /100 | #132 | Good 84.8% |
| Asians | 77.7 /100 | #133 | Good 84.8% |
| Syrians | 76.5 /100 | #134 | Good 84.8% |
| Immigrants | Hungary | 76.4 /100 | #135 | Good 84.8% |
| Bhutanese | 76.0 /100 | #136 | Good 84.8% |
| Immigrants | Canada | 73.5 /100 | #137 | Good 84.8% |
| Armenians | 72.7 /100 | #138 | Good 84.8% |
| Immigrants | Eastern Asia | 72.6 /100 | #139 | Good 84.8% |
| Immigrants | North America | 72.1 /100 | #140 | Good 84.8% |
| Danes | 71.9 /100 | #141 | Good 84.8% |
| Pakistanis | 70.0 /100 | #142 | Good 84.8% |
| Sri Lankans | 69.2 /100 | #143 | Good 84.8% |
| Immigrants | Laos | 69.0 /100 | #144 | Good 84.8% |
| Immigrants | Senegal | 68.3 /100 | #145 | Good 84.8% |
| Icelanders | 68.2 /100 | #146 | Good 84.8% |