Jordanian vs Burmese In Labor Force | Age 25-29
COMPARE
Jordanian
Burmese
In Labor Force | Age 25-29
In Labor Force | Age 25-29 Comparison
Jordanians
Burmese
84.2%
IN LABOR FORCE | AGE 25-29
6.7/ 100
METRIC RATING
222nd/ 347
METRIC RANK
85.1%
IN LABOR FORCE | AGE 25-29
95.9/ 100
METRIC RATING
90th/ 347
METRIC RANK
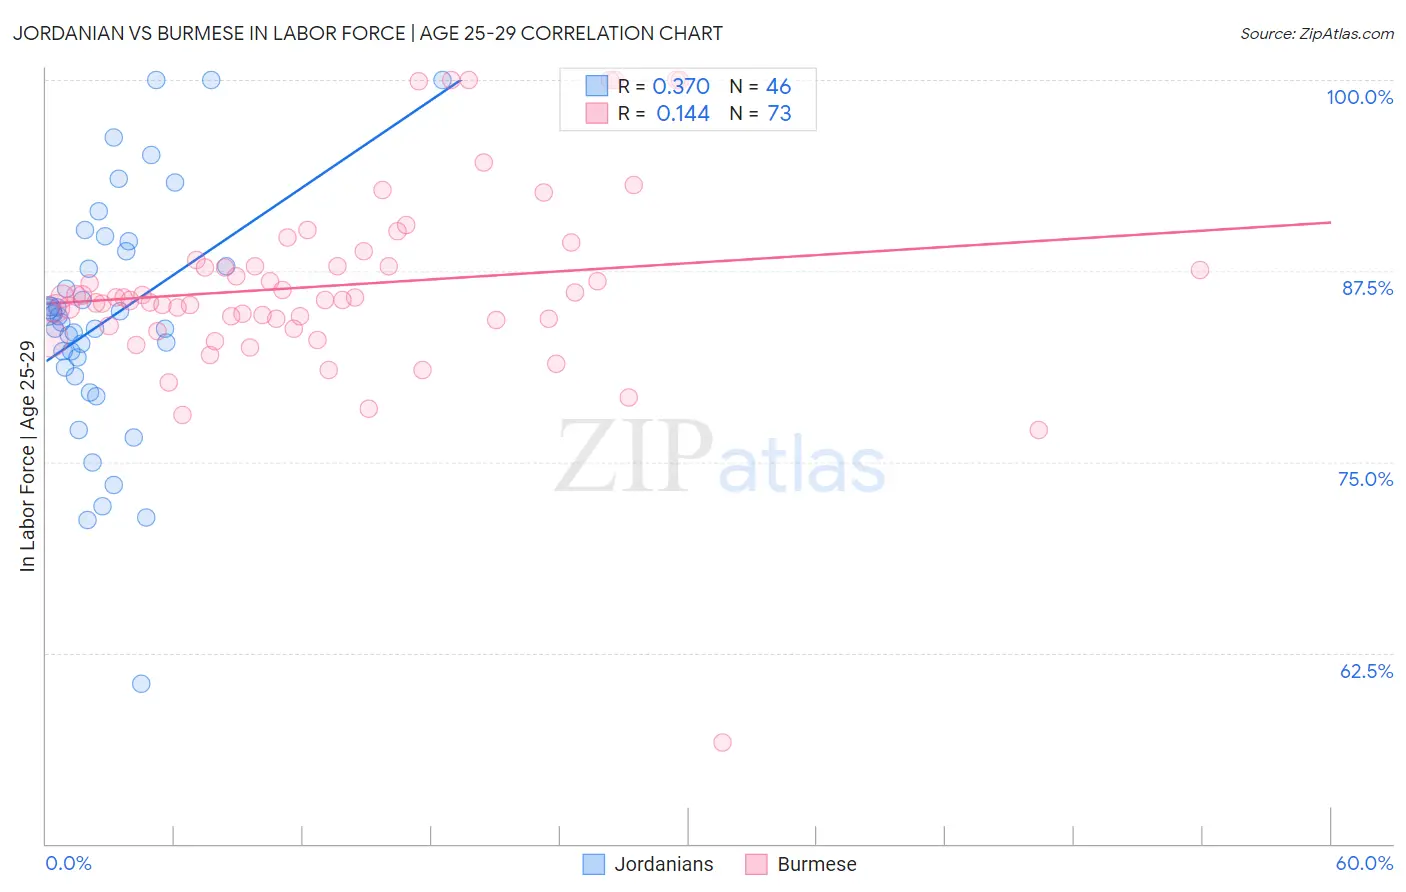
Jordanian vs Burmese In Labor Force | Age 25-29 Correlation Chart
The statistical analysis conducted on geographies consisting of 166,391,810 people shows a mild positive correlation between the proportion of Jordanians and labor force participation rate among population between the ages 25 and 29 in the United States with a correlation coefficient (R) of 0.370 and weighted average of 84.2%. Similarly, the statistical analysis conducted on geographies consisting of 465,170,348 people shows a poor positive correlation between the proportion of Burmese and labor force participation rate among population between the ages 25 and 29 in the United States with a correlation coefficient (R) of 0.144 and weighted average of 85.1%, a difference of 1.1%.
In Labor Force | Age 25-29 Correlation Summary
| Measurement | Jordanian | Burmese |
| Minimum | 60.5% | 56.6% |
| Maximum | 100.0% | 100.0% |
| Range | 39.5% | 43.4% |
| Mean | 84.4% | 86.5% |
| Median | 84.3% | 85.8% |
| Interquartile 25% (IQ1) | 81.2% | 84.1% |
| Interquartile 75% (IQ3) | 88.8% | 88.0% |
| Interquartile Range (IQR) | 7.6% | 3.9% |
| Standard Deviation (Sample) | 7.9% | 6.4% |
| Standard Deviation (Population) | 7.8% | 6.4% |
Similar Demographics by In Labor Force | Age 25-29
Demographics Similar to Jordanians by In Labor Force | Age 25-29
In terms of in labor force | age 25-29, the demographic groups most similar to Jordanians are Arab (84.2%, a difference of 0.0%), Nigerian (84.3%, a difference of 0.010%), Scotch-Irish (84.2%, a difference of 0.010%), Immigrants from West Indies (84.2%, a difference of 0.020%), and Korean (84.2%, a difference of 0.030%).
| Demographics | Rating | Rank | In Labor Force | Age 25-29 |
| Immigrants | Syria | 10.7 /100 | #215 | Poor 84.3% |
| Israelis | 9.3 /100 | #216 | Tragic 84.3% |
| Immigrants | Ecuador | 9.3 /100 | #217 | Tragic 84.3% |
| Immigrants | Nigeria | 9.0 /100 | #218 | Tragic 84.3% |
| Immigrants | Saudi Arabia | 8.8 /100 | #219 | Tragic 84.3% |
| Nigerians | 7.2 /100 | #220 | Tragic 84.3% |
| Arabs | 6.8 /100 | #221 | Tragic 84.2% |
| Jordanians | 6.7 /100 | #222 | Tragic 84.2% |
| Scotch-Irish | 6.5 /100 | #223 | Tragic 84.2% |
| Immigrants | West Indies | 6.0 /100 | #224 | Tragic 84.2% |
| Koreans | 5.9 /100 | #225 | Tragic 84.2% |
| Immigrants | Congo | 5.8 /100 | #226 | Tragic 84.2% |
| French American Indians | 5.5 /100 | #227 | Tragic 84.2% |
| Immigrants | Panama | 5.5 /100 | #228 | Tragic 84.2% |
| Immigrants | Oceania | 5.0 /100 | #229 | Tragic 84.2% |
Demographics Similar to Burmese by In Labor Force | Age 25-29
In terms of in labor force | age 25-29, the demographic groups most similar to Burmese are Immigrants from Moldova (85.1%, a difference of 0.010%), Immigrants from France (85.2%, a difference of 0.020%), Immigrants from Costa Rica (85.1%, a difference of 0.020%), French Canadian (85.2%, a difference of 0.030%), and Immigrants from Croatia (85.2%, a difference of 0.030%).
| Demographics | Rating | Rank | In Labor Force | Age 25-29 |
| Immigrants | Europe | 96.8 /100 | #83 | Exceptional 85.2% |
| Immigrants | Eastern Europe | 96.8 /100 | #84 | Exceptional 85.2% |
| Immigrants | Africa | 96.7 /100 | #85 | Exceptional 85.2% |
| Ukrainians | 96.7 /100 | #86 | Exceptional 85.2% |
| French Canadians | 96.5 /100 | #87 | Exceptional 85.2% |
| Immigrants | Croatia | 96.4 /100 | #88 | Exceptional 85.2% |
| Immigrants | France | 96.3 /100 | #89 | Exceptional 85.2% |
| Burmese | 95.9 /100 | #90 | Exceptional 85.1% |
| Immigrants | Moldova | 95.8 /100 | #91 | Exceptional 85.1% |
| Immigrants | Costa Rica | 95.5 /100 | #92 | Exceptional 85.1% |
| Austrians | 95.3 /100 | #93 | Exceptional 85.1% |
| Immigrants | Korea | 94.8 /100 | #94 | Exceptional 85.1% |
| Immigrants | Netherlands | 94.6 /100 | #95 | Exceptional 85.1% |
| Immigrants | Romania | 94.6 /100 | #96 | Exceptional 85.1% |
| Immigrants | Sudan | 94.3 /100 | #97 | Exceptional 85.1% |