Dutch West Indian vs Burmese In Labor Force | Age 25-29
COMPARE
Dutch West Indian
Burmese
In Labor Force | Age 25-29
In Labor Force | Age 25-29 Comparison
Dutch West Indians
Burmese
81.1%
IN LABOR FORCE | AGE 25-29
0.0/ 100
METRIC RATING
325th/ 347
METRIC RANK
85.1%
IN LABOR FORCE | AGE 25-29
95.9/ 100
METRIC RATING
90th/ 347
METRIC RANK
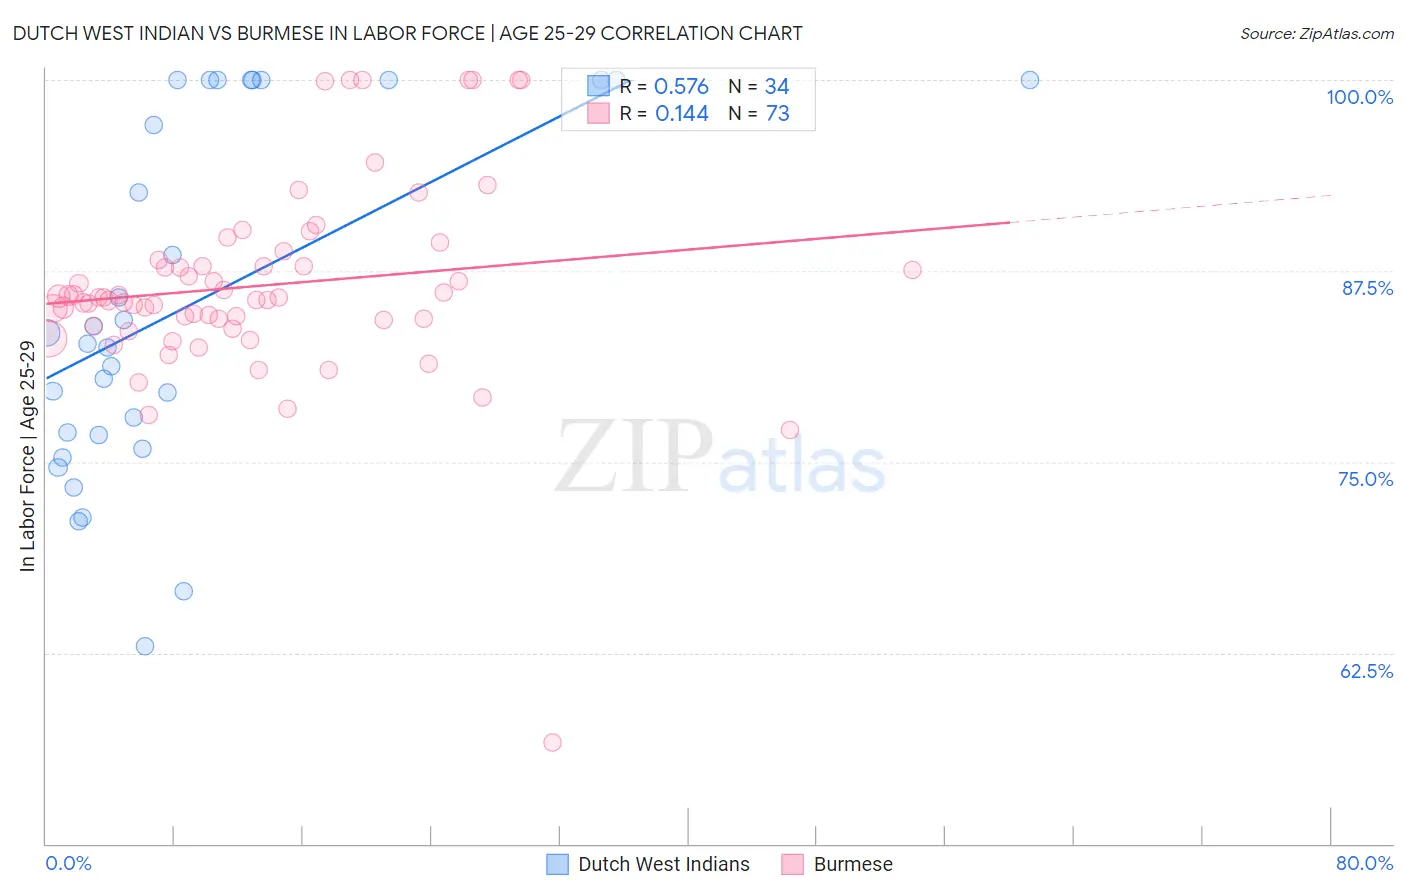
Dutch West Indian vs Burmese In Labor Force | Age 25-29 Correlation Chart
The statistical analysis conducted on geographies consisting of 85,749,797 people shows a substantial positive correlation between the proportion of Dutch West Indians and labor force participation rate among population between the ages 25 and 29 in the United States with a correlation coefficient (R) of 0.576 and weighted average of 81.1%. Similarly, the statistical analysis conducted on geographies consisting of 465,170,348 people shows a poor positive correlation between the proportion of Burmese and labor force participation rate among population between the ages 25 and 29 in the United States with a correlation coefficient (R) of 0.144 and weighted average of 85.1%, a difference of 4.9%.
In Labor Force | Age 25-29 Correlation Summary
| Measurement | Dutch West Indian | Burmese |
| Minimum | 62.9% | 56.6% |
| Maximum | 100.0% | 100.0% |
| Range | 37.1% | 43.4% |
| Mean | 85.4% | 86.5% |
| Median | 83.1% | 85.8% |
| Interquartile 25% (IQ1) | 76.8% | 84.1% |
| Interquartile 75% (IQ3) | 100.0% | 88.0% |
| Interquartile Range (IQR) | 23.2% | 3.9% |
| Standard Deviation (Sample) | 11.5% | 6.4% |
| Standard Deviation (Population) | 11.4% | 6.4% |
Similar Demographics by In Labor Force | Age 25-29
Demographics Similar to Dutch West Indians by In Labor Force | Age 25-29
In terms of in labor force | age 25-29, the demographic groups most similar to Dutch West Indians are Houma (81.2%, a difference of 0.11%), Choctaw (81.0%, a difference of 0.20%), Ute (80.8%, a difference of 0.41%), Alaska Native (81.6%, a difference of 0.52%), and Creek (80.7%, a difference of 0.55%).
| Demographics | Rating | Rank | In Labor Force | Age 25-29 |
| Comanche | 0.0 /100 | #318 | Tragic 81.9% |
| Seminole | 0.0 /100 | #319 | Tragic 81.7% |
| Colville | 0.0 /100 | #320 | Tragic 81.6% |
| Shoshone | 0.0 /100 | #321 | Tragic 81.6% |
| Kiowa | 0.0 /100 | #322 | Tragic 81.6% |
| Alaska Natives | 0.0 /100 | #323 | Tragic 81.6% |
| Houma | 0.0 /100 | #324 | Tragic 81.2% |
| Dutch West Indians | 0.0 /100 | #325 | Tragic 81.1% |
| Choctaw | 0.0 /100 | #326 | Tragic 81.0% |
| Ute | 0.0 /100 | #327 | Tragic 80.8% |
| Creek | 0.0 /100 | #328 | Tragic 80.7% |
| Yakama | 0.0 /100 | #329 | Tragic 80.6% |
| Puerto Ricans | 0.0 /100 | #330 | Tragic 80.4% |
| Cheyenne | 0.0 /100 | #331 | Tragic 80.3% |
| Inupiat | 0.0 /100 | #332 | Tragic 79.8% |
Demographics Similar to Burmese by In Labor Force | Age 25-29
In terms of in labor force | age 25-29, the demographic groups most similar to Burmese are Immigrants from Moldova (85.1%, a difference of 0.010%), Immigrants from France (85.2%, a difference of 0.020%), Immigrants from Costa Rica (85.1%, a difference of 0.020%), French Canadian (85.2%, a difference of 0.030%), and Immigrants from Croatia (85.2%, a difference of 0.030%).
| Demographics | Rating | Rank | In Labor Force | Age 25-29 |
| Immigrants | Europe | 96.8 /100 | #83 | Exceptional 85.2% |
| Immigrants | Eastern Europe | 96.8 /100 | #84 | Exceptional 85.2% |
| Immigrants | Africa | 96.7 /100 | #85 | Exceptional 85.2% |
| Ukrainians | 96.7 /100 | #86 | Exceptional 85.2% |
| French Canadians | 96.5 /100 | #87 | Exceptional 85.2% |
| Immigrants | Croatia | 96.4 /100 | #88 | Exceptional 85.2% |
| Immigrants | France | 96.3 /100 | #89 | Exceptional 85.2% |
| Burmese | 95.9 /100 | #90 | Exceptional 85.1% |
| Immigrants | Moldova | 95.8 /100 | #91 | Exceptional 85.1% |
| Immigrants | Costa Rica | 95.5 /100 | #92 | Exceptional 85.1% |
| Austrians | 95.3 /100 | #93 | Exceptional 85.1% |
| Immigrants | Korea | 94.8 /100 | #94 | Exceptional 85.1% |
| Immigrants | Netherlands | 94.6 /100 | #95 | Exceptional 85.1% |
| Immigrants | Romania | 94.6 /100 | #96 | Exceptional 85.1% |
| Immigrants | Sudan | 94.3 /100 | #97 | Exceptional 85.1% |