French Canadian vs Dutch In Labor Force | Age 25-29
COMPARE
French Canadian
Dutch
In Labor Force | Age 25-29
In Labor Force | Age 25-29 Comparison
French Canadians
Dutch
85.2%
IN LABOR FORCE | AGE 25-29
96.5/ 100
METRIC RATING
87th/ 347
METRIC RANK
84.9%
IN LABOR FORCE | AGE 25-29
84.9/ 100
METRIC RATING
123rd/ 347
METRIC RANK
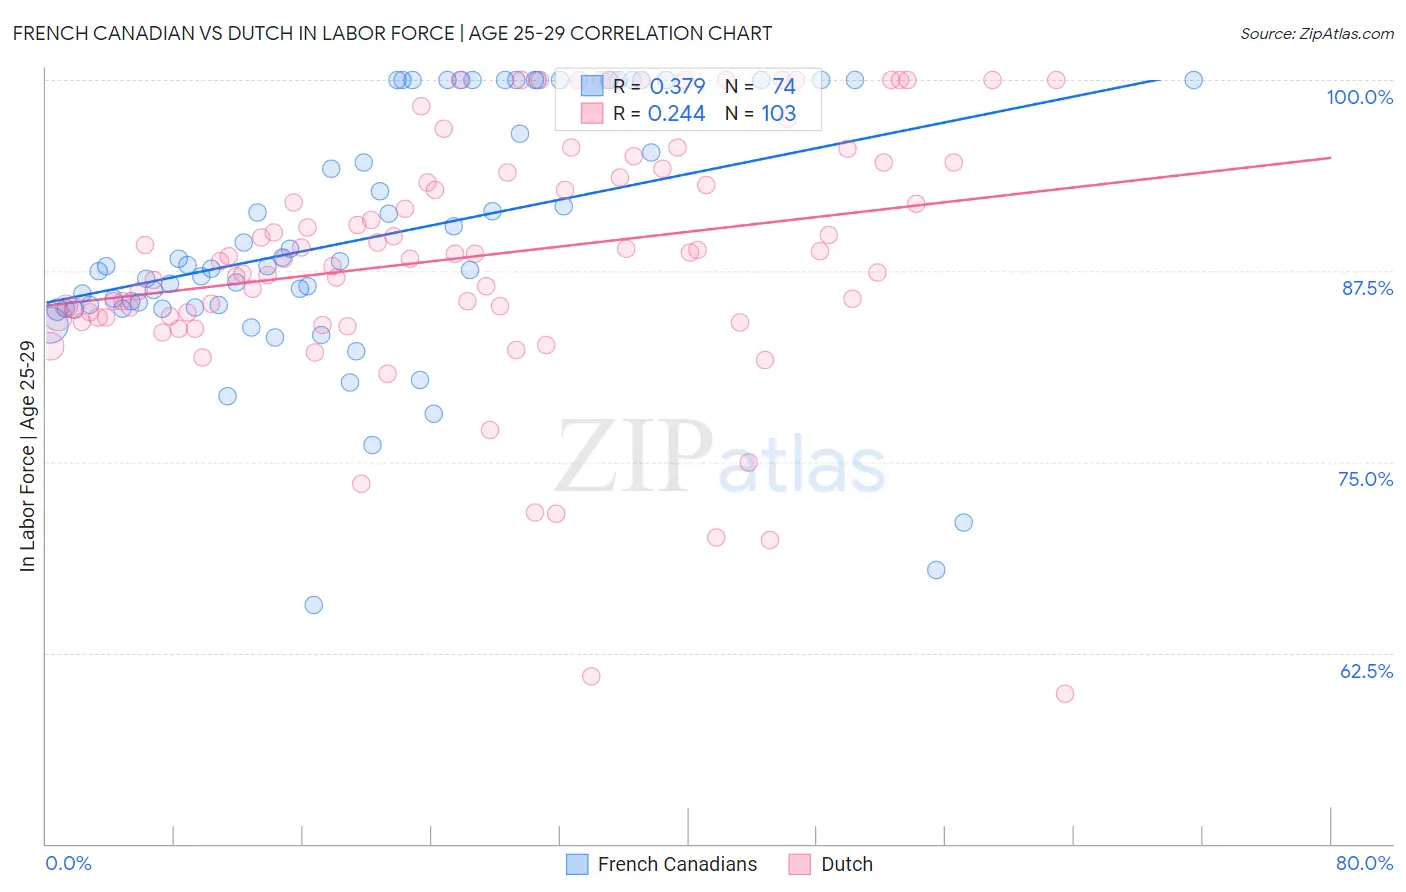
French Canadian vs Dutch In Labor Force | Age 25-29 Correlation Chart
The statistical analysis conducted on geographies consisting of 502,121,240 people shows a mild positive correlation between the proportion of French Canadians and labor force participation rate among population between the ages 25 and 29 in the United States with a correlation coefficient (R) of 0.379 and weighted average of 85.2%. Similarly, the statistical analysis conducted on geographies consisting of 553,362,639 people shows a weak positive correlation between the proportion of Dutch and labor force participation rate among population between the ages 25 and 29 in the United States with a correlation coefficient (R) of 0.244 and weighted average of 84.9%, a difference of 0.29%.
In Labor Force | Age 25-29 Correlation Summary
| Measurement | French Canadian | Dutch |
| Minimum | 65.6% | 59.8% |
| Maximum | 100.0% | 100.0% |
| Range | 34.4% | 40.2% |
| Mean | 89.8% | 88.5% |
| Median | 87.8% | 88.4% |
| Interquartile 25% (IQ1) | 85.1% | 84.5% |
| Interquartile 75% (IQ3) | 100.0% | 94.2% |
| Interquartile Range (IQR) | 14.9% | 9.7% |
| Standard Deviation (Sample) | 8.2% | 8.2% |
| Standard Deviation (Population) | 8.2% | 8.2% |
Similar Demographics by In Labor Force | Age 25-29
Demographics Similar to French Canadians by In Labor Force | Age 25-29
In terms of in labor force | age 25-29, the demographic groups most similar to French Canadians are Immigrants from Croatia (85.2%, a difference of 0.0%), Immigrants from Eastern Europe (85.2%, a difference of 0.010%), Immigrants from Africa (85.2%, a difference of 0.010%), Ukrainian (85.2%, a difference of 0.010%), and Immigrants from France (85.2%, a difference of 0.010%).
| Demographics | Rating | Rank | In Labor Force | Age 25-29 |
| Immigrants | Zimbabwe | 97.6 /100 | #80 | Exceptional 85.2% |
| Immigrants | Northern Europe | 97.2 /100 | #81 | Exceptional 85.2% |
| Okinawans | 97.0 /100 | #82 | Exceptional 85.2% |
| Immigrants | Europe | 96.8 /100 | #83 | Exceptional 85.2% |
| Immigrants | Eastern Europe | 96.8 /100 | #84 | Exceptional 85.2% |
| Immigrants | Africa | 96.7 /100 | #85 | Exceptional 85.2% |
| Ukrainians | 96.7 /100 | #86 | Exceptional 85.2% |
| French Canadians | 96.5 /100 | #87 | Exceptional 85.2% |
| Immigrants | Croatia | 96.4 /100 | #88 | Exceptional 85.2% |
| Immigrants | France | 96.3 /100 | #89 | Exceptional 85.2% |
| Burmese | 95.9 /100 | #90 | Exceptional 85.1% |
| Immigrants | Moldova | 95.8 /100 | #91 | Exceptional 85.1% |
| Immigrants | Costa Rica | 95.5 /100 | #92 | Exceptional 85.1% |
| Austrians | 95.3 /100 | #93 | Exceptional 85.1% |
| Immigrants | Korea | 94.8 /100 | #94 | Exceptional 85.1% |
Demographics Similar to Dutch by In Labor Force | Age 25-29
In terms of in labor force | age 25-29, the demographic groups most similar to Dutch are Scandinavian (84.9%, a difference of 0.0%), Immigrants from Iran (84.9%, a difference of 0.0%), Uruguayan (84.9%, a difference of 0.0%), Immigrants from Chile (84.9%, a difference of 0.010%), and Immigrants from Singapore (84.9%, a difference of 0.010%).
| Demographics | Rating | Rank | In Labor Force | Age 25-29 |
| Chileans | 88.8 /100 | #116 | Excellent 85.0% |
| Immigrants | Belarus | 88.0 /100 | #117 | Excellent 85.0% |
| Finns | 87.8 /100 | #118 | Excellent 85.0% |
| Filipinos | 87.1 /100 | #119 | Excellent 84.9% |
| Immigrants | South Africa | 86.1 /100 | #120 | Excellent 84.9% |
| Immigrants | Chile | 85.6 /100 | #121 | Excellent 84.9% |
| Scandinavians | 85.1 /100 | #122 | Excellent 84.9% |
| Dutch | 84.9 /100 | #123 | Excellent 84.9% |
| Immigrants | Iran | 84.8 /100 | #124 | Excellent 84.9% |
| Uruguayans | 84.7 /100 | #125 | Excellent 84.9% |
| Immigrants | Singapore | 84.4 /100 | #126 | Excellent 84.9% |
| Immigrants | Uruguay | 84.0 /100 | #127 | Excellent 84.9% |
| Australians | 83.6 /100 | #128 | Excellent 84.9% |
| Immigrants | Russia | 81.6 /100 | #129 | Excellent 84.9% |
| Northern Europeans | 81.3 /100 | #130 | Excellent 84.9% |