French Canadian vs Immigrants from Nigeria In Labor Force | Age 35-44
COMPARE
French Canadian
Immigrants from Nigeria
In Labor Force | Age 35-44
In Labor Force | Age 35-44 Comparison
French Canadians
Immigrants from Nigeria
84.3%
IN LABOR FORCE | AGE 35-44
44.3/ 100
METRIC RATING
177th/ 347
METRIC RANK
84.5%
IN LABOR FORCE | AGE 35-44
73.3/ 100
METRIC RATING
150th/ 347
METRIC RANK
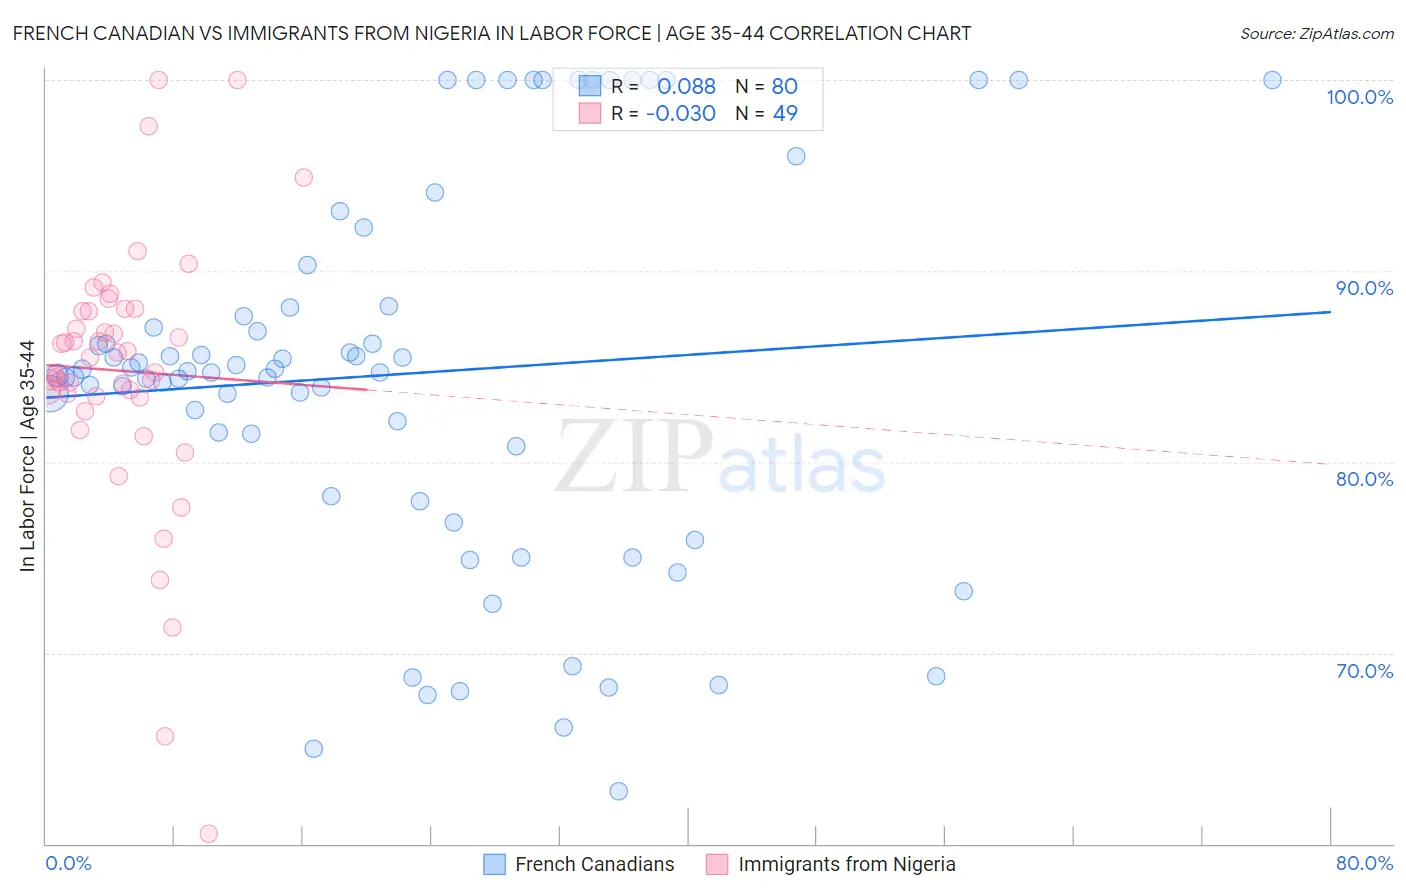
French Canadian vs Immigrants from Nigeria In Labor Force | Age 35-44 Correlation Chart
The statistical analysis conducted on geographies consisting of 502,298,935 people shows a slight positive correlation between the proportion of French Canadians and labor force participation rate among population between the ages 35 and 44 in the United States with a correlation coefficient (R) of 0.088 and weighted average of 84.3%. Similarly, the statistical analysis conducted on geographies consisting of 283,331,334 people shows no correlation between the proportion of Immigrants from Nigeria and labor force participation rate among population between the ages 35 and 44 in the United States with a correlation coefficient (R) of -0.030 and weighted average of 84.5%, a difference of 0.20%.
In Labor Force | Age 35-44 Correlation Summary
| Measurement | French Canadian | Immigrants from Nigeria |
| Minimum | 62.7% | 60.5% |
| Maximum | 100.0% | 100.0% |
| Range | 37.3% | 39.5% |
| Mean | 84.6% | 84.8% |
| Median | 84.7% | 85.4% |
| Interquartile 25% (IQ1) | 79.5% | 83.4% |
| Interquartile 75% (IQ3) | 88.1% | 88.0% |
| Interquartile Range (IQR) | 8.6% | 4.6% |
| Standard Deviation (Sample) | 9.9% | 7.1% |
| Standard Deviation (Population) | 9.8% | 7.0% |
Similar Demographics by In Labor Force | Age 35-44
Demographics Similar to French Canadians by In Labor Force | Age 35-44
In terms of in labor force | age 35-44, the demographic groups most similar to French Canadians are Northern European (84.3%, a difference of 0.0%), Immigrants from South Africa (84.3%, a difference of 0.010%), Sri Lankan (84.4%, a difference of 0.020%), Pakistani (84.4%, a difference of 0.030%), and Scandinavian (84.4%, a difference of 0.040%).
| Demographics | Rating | Rank | In Labor Force | Age 35-44 |
| Immigrants | Jordan | 52.5 /100 | #170 | Average 84.4% |
| Jordanians | 51.7 /100 | #171 | Average 84.4% |
| Scandinavians | 51.2 /100 | #172 | Average 84.4% |
| Immigrants | Trinidad and Tobago | 50.7 /100 | #173 | Average 84.4% |
| Immigrants | Iran | 50.0 /100 | #174 | Average 84.4% |
| Pakistanis | 48.2 /100 | #175 | Average 84.4% |
| Sri Lankans | 47.3 /100 | #176 | Average 84.4% |
| French Canadians | 44.3 /100 | #177 | Average 84.3% |
| Northern Europeans | 44.1 /100 | #178 | Average 84.3% |
| Immigrants | South Africa | 42.8 /100 | #179 | Average 84.3% |
| Danes | 38.8 /100 | #180 | Fair 84.3% |
| Immigrants | West Indies | 36.4 /100 | #181 | Fair 84.3% |
| Koreans | 36.3 /100 | #182 | Fair 84.3% |
| Barbadians | 36.2 /100 | #183 | Fair 84.3% |
| Armenians | 35.6 /100 | #184 | Fair 84.3% |
Demographics Similar to Immigrants from Nigeria by In Labor Force | Age 35-44
In terms of in labor force | age 35-44, the demographic groups most similar to Immigrants from Nigeria are South American Indian (84.5%, a difference of 0.0%), Okinawan (84.5%, a difference of 0.0%), Romanian (84.5%, a difference of 0.010%), Immigrants from Taiwan (84.5%, a difference of 0.020%), and Immigrants from Netherlands (84.5%, a difference of 0.030%).
| Demographics | Rating | Rank | In Labor Force | Age 35-44 |
| Immigrants | Ukraine | 79.7 /100 | #143 | Good 84.6% |
| Immigrants | Jamaica | 79.4 /100 | #144 | Good 84.6% |
| Immigrants | Saudi Arabia | 79.4 /100 | #145 | Good 84.6% |
| Immigrants | Asia | 78.7 /100 | #146 | Good 84.5% |
| Immigrants | Netherlands | 76.6 /100 | #147 | Good 84.5% |
| South American Indians | 73.6 /100 | #148 | Good 84.5% |
| Okinawans | 73.5 /100 | #149 | Good 84.5% |
| Immigrants | Nigeria | 73.3 /100 | #150 | Good 84.5% |
| Romanians | 72.1 /100 | #151 | Good 84.5% |
| Immigrants | Taiwan | 71.4 /100 | #152 | Good 84.5% |
| Trinidadians and Tobagonians | 69.5 /100 | #153 | Good 84.5% |
| Iranians | 69.4 /100 | #154 | Good 84.5% |
| Immigrants | Switzerland | 65.9 /100 | #155 | Good 84.5% |
| Immigrants | Israel | 64.3 /100 | #156 | Good 84.4% |
| Immigrants | Austria | 63.8 /100 | #157 | Good 84.4% |