French Canadian vs Lumbee 7th Grade
COMPARE
French Canadian
Lumbee
7th Grade
7th Grade Comparison
French Canadians
Lumbee
97.4%
7TH GRADE
100.0/ 100
METRIC RATING
22nd/ 347
METRIC RANK
96.6%
7TH GRADE
97.8/ 100
METRIC RATING
107th/ 347
METRIC RANK
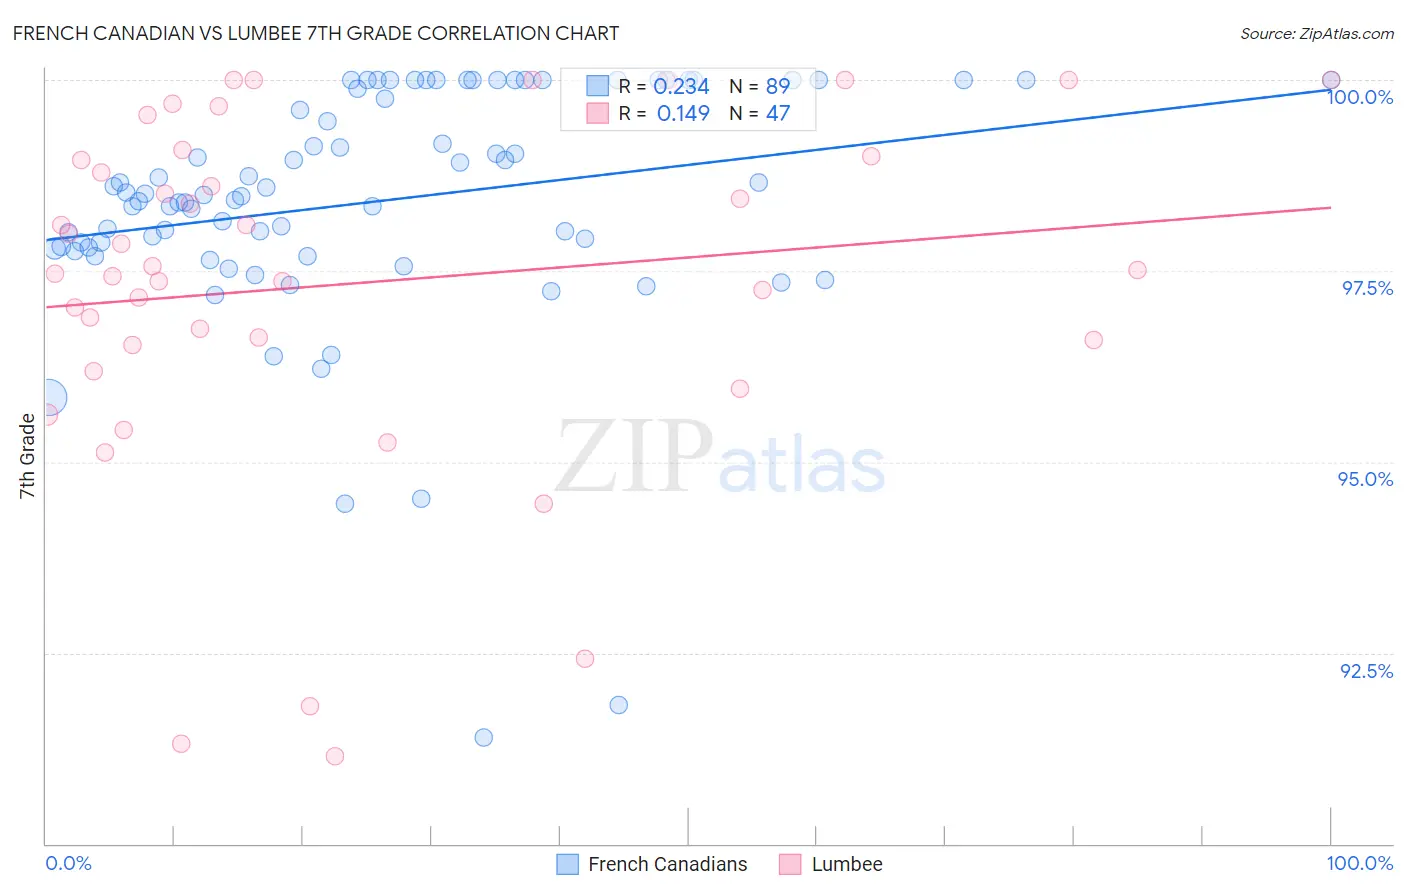
French Canadian vs Lumbee 7th Grade Correlation Chart
The statistical analysis conducted on geographies consisting of 502,678,839 people shows a weak positive correlation between the proportion of French Canadians and percentage of population with at least 7th grade education in the United States with a correlation coefficient (R) of 0.234 and weighted average of 97.4%. Similarly, the statistical analysis conducted on geographies consisting of 92,299,110 people shows a poor positive correlation between the proportion of Lumbee and percentage of population with at least 7th grade education in the United States with a correlation coefficient (R) of 0.149 and weighted average of 96.6%, a difference of 0.86%.
7th Grade Correlation Summary
| Measurement | French Canadian | Lumbee |
| Minimum | 91.4% | 91.1% |
| Maximum | 100.0% | 100.0% |
| Range | 8.6% | 8.9% |
| Mean | 98.4% | 97.3% |
| Median | 98.5% | 97.5% |
| Interquartile 25% (IQ1) | 97.8% | 96.5% |
| Interquartile 75% (IQ3) | 100.0% | 99.0% |
| Interquartile Range (IQR) | 2.2% | 2.5% |
| Standard Deviation (Sample) | 1.6% | 2.3% |
| Standard Deviation (Population) | 1.6% | 2.3% |
Similar Demographics by 7th Grade
Demographics Similar to French Canadians by 7th Grade
In terms of 7th grade, the demographic groups most similar to French Canadians are Inupiat (97.4%, a difference of 0.0%), Yup'ik (97.4%, a difference of 0.020%), Croatian (97.4%, a difference of 0.020%), Welsh (97.4%, a difference of 0.030%), and French (97.4%, a difference of 0.030%).
| Demographics | Rating | Rank | 7th Grade |
| English | 100.0 /100 | #15 | Exceptional 97.6% |
| Irish | 100.0 /100 | #16 | Exceptional 97.5% |
| Scottish | 100.0 /100 | #17 | Exceptional 97.5% |
| Tlingit-Haida | 100.0 /100 | #18 | Exceptional 97.5% |
| Lithuanians | 100.0 /100 | #19 | Exceptional 97.5% |
| Yup'ik | 100.0 /100 | #20 | Exceptional 97.4% |
| Inupiat | 100.0 /100 | #21 | Exceptional 97.4% |
| French Canadians | 100.0 /100 | #22 | Exceptional 97.4% |
| Croatians | 100.0 /100 | #23 | Exceptional 97.4% |
| Welsh | 100.0 /100 | #24 | Exceptional 97.4% |
| French | 100.0 /100 | #25 | Exceptional 97.4% |
| Scotch-Irish | 100.0 /100 | #26 | Exceptional 97.4% |
| Danes | 100.0 /100 | #27 | Exceptional 97.4% |
| Sioux | 100.0 /100 | #28 | Exceptional 97.4% |
| Scandinavians | 100.0 /100 | #29 | Exceptional 97.4% |
Demographics Similar to Lumbee by 7th Grade
In terms of 7th grade, the demographic groups most similar to Lumbee are Immigrants from Saudi Arabia (96.6%, a difference of 0.0%), Iroquois (96.6%, a difference of 0.010%), Bhutanese (96.6%, a difference of 0.010%), Shoshone (96.6%, a difference of 0.020%), and South African (96.6%, a difference of 0.020%).
| Demographics | Rating | Rank | 7th Grade |
| German Russians | 98.6 /100 | #100 | Exceptional 96.7% |
| Thais | 98.6 /100 | #101 | Exceptional 96.7% |
| Immigrants | Czechoslovakia | 98.3 /100 | #102 | Exceptional 96.6% |
| Immigrants | Singapore | 98.3 /100 | #103 | Exceptional 96.6% |
| Shoshone | 98.1 /100 | #104 | Exceptional 96.6% |
| South Africans | 98.0 /100 | #105 | Exceptional 96.6% |
| Iroquois | 97.9 /100 | #106 | Exceptional 96.6% |
| Lumbee | 97.8 /100 | #107 | Exceptional 96.6% |
| Immigrants | Saudi Arabia | 97.8 /100 | #108 | Exceptional 96.6% |
| Bhutanese | 97.7 /100 | #109 | Exceptional 96.6% |
| Okinawans | 97.4 /100 | #110 | Exceptional 96.6% |
| Immigrants | Latvia | 97.4 /100 | #111 | Exceptional 96.6% |
| Immigrants | Nonimmigrants | 97.0 /100 | #112 | Exceptional 96.5% |
| Pueblo | 96.8 /100 | #113 | Exceptional 96.5% |
| Immigrants | Zimbabwe | 96.6 /100 | #114 | Exceptional 96.5% |