French American Indian vs Scottish In Labor Force | Age 16-19
COMPARE
French American Indian
Scottish
In Labor Force | Age 16-19
In Labor Force | Age 16-19 Comparison
French American Indians
Scottish
39.8%
IN LABOR FORCE | AGE 16-19
99.9/ 100
METRIC RATING
75th/ 347
METRIC RANK
42.0%
IN LABOR FORCE | AGE 16-19
100.0/ 100
METRIC RATING
30th/ 347
METRIC RANK
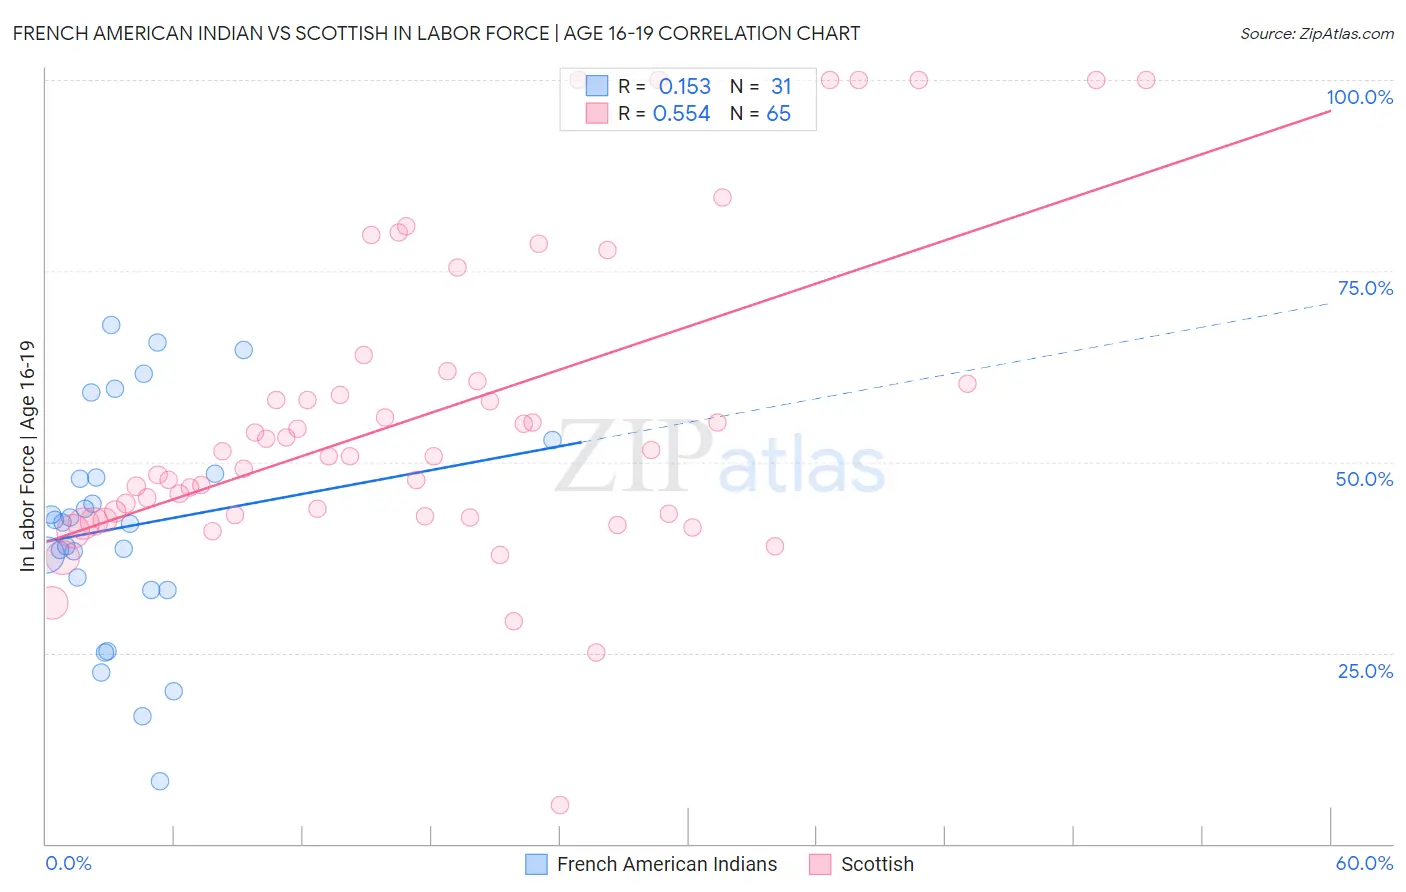
French American Indian vs Scottish In Labor Force | Age 16-19 Correlation Chart
The statistical analysis conducted on geographies consisting of 131,885,422 people shows a poor positive correlation between the proportion of French American Indians and labor force participation rate among population between the ages 16 and 19 in the United States with a correlation coefficient (R) of 0.153 and weighted average of 39.8%. Similarly, the statistical analysis conducted on geographies consisting of 562,983,292 people shows a substantial positive correlation between the proportion of Scottish and labor force participation rate among population between the ages 16 and 19 in the United States with a correlation coefficient (R) of 0.554 and weighted average of 42.0%, a difference of 5.4%.
In Labor Force | Age 16-19 Correlation Summary
| Measurement | French American Indian | Scottish |
| Minimum | 8.2% | 5.0% |
| Maximum | 68.0% | 100.0% |
| Range | 59.8% | 95.0% |
| Mean | 41.5% | 56.2% |
| Median | 42.0% | 50.8% |
| Interquartile 25% (IQ1) | 33.3% | 42.9% |
| Interquartile 75% (IQ3) | 48.4% | 61.2% |
| Interquartile Range (IQR) | 15.1% | 18.3% |
| Standard Deviation (Sample) | 14.7% | 20.5% |
| Standard Deviation (Population) | 14.4% | 20.4% |
Similar Demographics by In Labor Force | Age 16-19
Demographics Similar to French American Indians by In Labor Force | Age 16-19
In terms of in labor force | age 16-19, the demographic groups most similar to French American Indians are Hungarian (39.8%, a difference of 0.020%), Immigrants from Middle Africa (39.9%, a difference of 0.25%), Malaysian (39.7%, a difference of 0.27%), Serbian (39.9%, a difference of 0.29%), and Iroquois (39.9%, a difference of 0.29%).
| Demographics | Rating | Rank | In Labor Force | Age 16-19 |
| Italians | 99.9 /100 | #68 | Exceptional 40.1% |
| Potawatomi | 99.9 /100 | #69 | Exceptional 40.0% |
| Portuguese | 99.9 /100 | #70 | Exceptional 40.0% |
| Serbians | 99.9 /100 | #71 | Exceptional 39.9% |
| Iroquois | 99.9 /100 | #72 | Exceptional 39.9% |
| Immigrants | Middle Africa | 99.9 /100 | #73 | Exceptional 39.9% |
| Hungarians | 99.9 /100 | #74 | Exceptional 39.8% |
| French American Indians | 99.9 /100 | #75 | Exceptional 39.8% |
| Malaysians | 99.9 /100 | #76 | Exceptional 39.7% |
| Immigrants | Portugal | 99.9 /100 | #77 | Exceptional 39.7% |
| Austrians | 99.8 /100 | #78 | Exceptional 39.5% |
| Marshallese | 99.8 /100 | #79 | Exceptional 39.5% |
| Immigrants | Iraq | 99.8 /100 | #80 | Exceptional 39.4% |
| Shoshone | 99.7 /100 | #81 | Exceptional 39.3% |
| Basques | 99.7 /100 | #82 | Exceptional 39.3% |
Demographics Similar to Scottish by In Labor Force | Age 16-19
In terms of in labor force | age 16-19, the demographic groups most similar to Scottish are Irish (42.0%, a difference of 0.070%), Czechoslovakian (41.9%, a difference of 0.27%), French (42.1%, a difference of 0.28%), Polish (42.1%, a difference of 0.33%), and Liberian (41.8%, a difference of 0.41%).
| Demographics | Rating | Rank | In Labor Force | Age 16-19 |
| Slovaks | 100.0 /100 | #23 | Exceptional 42.6% |
| Bangladeshis | 100.0 /100 | #24 | Exceptional 42.5% |
| German Russians | 100.0 /100 | #25 | Exceptional 42.4% |
| English | 100.0 /100 | #26 | Exceptional 42.4% |
| Welsh | 100.0 /100 | #27 | Exceptional 42.3% |
| Poles | 100.0 /100 | #28 | Exceptional 42.1% |
| French | 100.0 /100 | #29 | Exceptional 42.1% |
| Scottish | 100.0 /100 | #30 | Exceptional 42.0% |
| Irish | 100.0 /100 | #31 | Exceptional 42.0% |
| Czechoslovakians | 100.0 /100 | #32 | Exceptional 41.9% |
| Liberians | 100.0 /100 | #33 | Exceptional 41.8% |
| Immigrants | Bosnia and Herzegovina | 100.0 /100 | #34 | Exceptional 41.8% |
| Yugoslavians | 100.0 /100 | #35 | Exceptional 41.8% |
| Immigrants | Azores | 100.0 /100 | #36 | Exceptional 41.7% |
| Immigrants | Congo | 100.0 /100 | #37 | Exceptional 41.7% |