French American Indian vs Immigrants from Spain In Labor Force | Age 16-19
COMPARE
French American Indian
Immigrants from Spain
In Labor Force | Age 16-19
In Labor Force | Age 16-19 Comparison
French American Indians
Immigrants from Spain
39.8%
IN LABOR FORCE | AGE 16-19
99.9/ 100
METRIC RATING
75th/ 347
METRIC RANK
33.7%
IN LABOR FORCE | AGE 16-19
0.2/ 100
METRIC RATING
284th/ 347
METRIC RANK
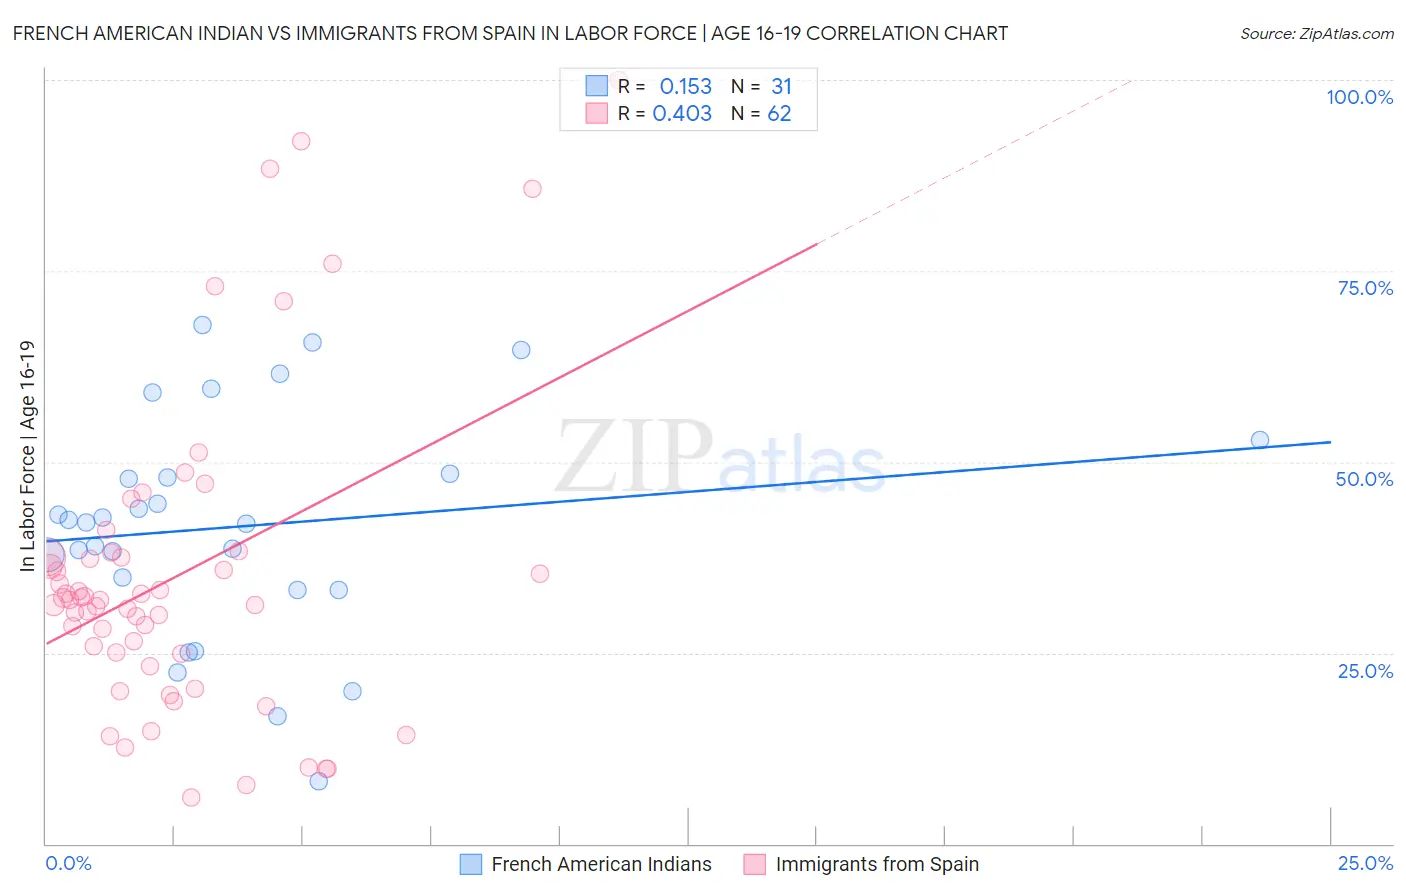
French American Indian vs Immigrants from Spain In Labor Force | Age 16-19 Correlation Chart
The statistical analysis conducted on geographies consisting of 131,885,422 people shows a poor positive correlation between the proportion of French American Indians and labor force participation rate among population between the ages 16 and 19 in the United States with a correlation coefficient (R) of 0.153 and weighted average of 39.8%. Similarly, the statistical analysis conducted on geographies consisting of 239,401,400 people shows a moderate positive correlation between the proportion of Immigrants from Spain and labor force participation rate among population between the ages 16 and 19 in the United States with a correlation coefficient (R) of 0.403 and weighted average of 33.7%, a difference of 18.3%.
In Labor Force | Age 16-19 Correlation Summary
| Measurement | French American Indian | Immigrants from Spain |
| Minimum | 8.2% | 6.1% |
| Maximum | 68.0% | 100.0% |
| Range | 59.8% | 93.9% |
| Mean | 41.5% | 35.1% |
| Median | 42.0% | 31.9% |
| Interquartile 25% (IQ1) | 33.3% | 24.8% |
| Interquartile 75% (IQ3) | 48.4% | 37.5% |
| Interquartile Range (IQR) | 15.1% | 12.7% |
| Standard Deviation (Sample) | 14.7% | 20.5% |
| Standard Deviation (Population) | 14.4% | 20.3% |
Similar Demographics by In Labor Force | Age 16-19
Demographics Similar to French American Indians by In Labor Force | Age 16-19
In terms of in labor force | age 16-19, the demographic groups most similar to French American Indians are Hungarian (39.8%, a difference of 0.020%), Immigrants from Middle Africa (39.9%, a difference of 0.25%), Malaysian (39.7%, a difference of 0.27%), Serbian (39.9%, a difference of 0.29%), and Iroquois (39.9%, a difference of 0.29%).
| Demographics | Rating | Rank | In Labor Force | Age 16-19 |
| Italians | 99.9 /100 | #68 | Exceptional 40.1% |
| Potawatomi | 99.9 /100 | #69 | Exceptional 40.0% |
| Portuguese | 99.9 /100 | #70 | Exceptional 40.0% |
| Serbians | 99.9 /100 | #71 | Exceptional 39.9% |
| Iroquois | 99.9 /100 | #72 | Exceptional 39.9% |
| Immigrants | Middle Africa | 99.9 /100 | #73 | Exceptional 39.9% |
| Hungarians | 99.9 /100 | #74 | Exceptional 39.8% |
| French American Indians | 99.9 /100 | #75 | Exceptional 39.8% |
| Malaysians | 99.9 /100 | #76 | Exceptional 39.7% |
| Immigrants | Portugal | 99.9 /100 | #77 | Exceptional 39.7% |
| Austrians | 99.8 /100 | #78 | Exceptional 39.5% |
| Marshallese | 99.8 /100 | #79 | Exceptional 39.5% |
| Immigrants | Iraq | 99.8 /100 | #80 | Exceptional 39.4% |
| Shoshone | 99.7 /100 | #81 | Exceptional 39.3% |
| Basques | 99.7 /100 | #82 | Exceptional 39.3% |
Demographics Similar to Immigrants from Spain by In Labor Force | Age 16-19
In terms of in labor force | age 16-19, the demographic groups most similar to Immigrants from Spain are Immigrants from Venezuela (33.7%, a difference of 0.060%), U.S. Virgin Islander (33.6%, a difference of 0.19%), South American (33.6%, a difference of 0.27%), Immigrants from Korea (33.8%, a difference of 0.41%), and Cypriot (33.8%, a difference of 0.42%).
| Demographics | Rating | Rank | In Labor Force | Age 16-19 |
| Menominee | 0.3 /100 | #277 | Tragic 33.9% |
| Colombians | 0.3 /100 | #278 | Tragic 33.8% |
| Paraguayans | 0.3 /100 | #279 | Tragic 33.8% |
| Taiwanese | 0.3 /100 | #280 | Tragic 33.8% |
| Cypriots | 0.3 /100 | #281 | Tragic 33.8% |
| Immigrants | Korea | 0.3 /100 | #282 | Tragic 33.8% |
| Immigrants | Venezuela | 0.2 /100 | #283 | Tragic 33.7% |
| Immigrants | Spain | 0.2 /100 | #284 | Tragic 33.7% |
| U.S. Virgin Islanders | 0.2 /100 | #285 | Tragic 33.6% |
| South Americans | 0.2 /100 | #286 | Tragic 33.6% |
| Nepalese | 0.1 /100 | #287 | Tragic 33.5% |
| Immigrants | Indonesia | 0.1 /100 | #288 | Tragic 33.5% |
| Immigrants | Singapore | 0.1 /100 | #289 | Tragic 33.5% |
| Immigrants | Colombia | 0.1 /100 | #290 | Tragic 33.5% |
| Immigrants | Belarus | 0.1 /100 | #291 | Tragic 33.4% |