Spaniard vs Scottish In Labor Force | Age 16-19
COMPARE
Spaniard
Scottish
In Labor Force | Age 16-19
In Labor Force | Age 16-19 Comparison
Spaniards
Scottish
38.0%
IN LABOR FORCE | AGE 16-19
95.5/ 100
METRIC RATING
129th/ 347
METRIC RANK
42.0%
IN LABOR FORCE | AGE 16-19
100.0/ 100
METRIC RATING
30th/ 347
METRIC RANK
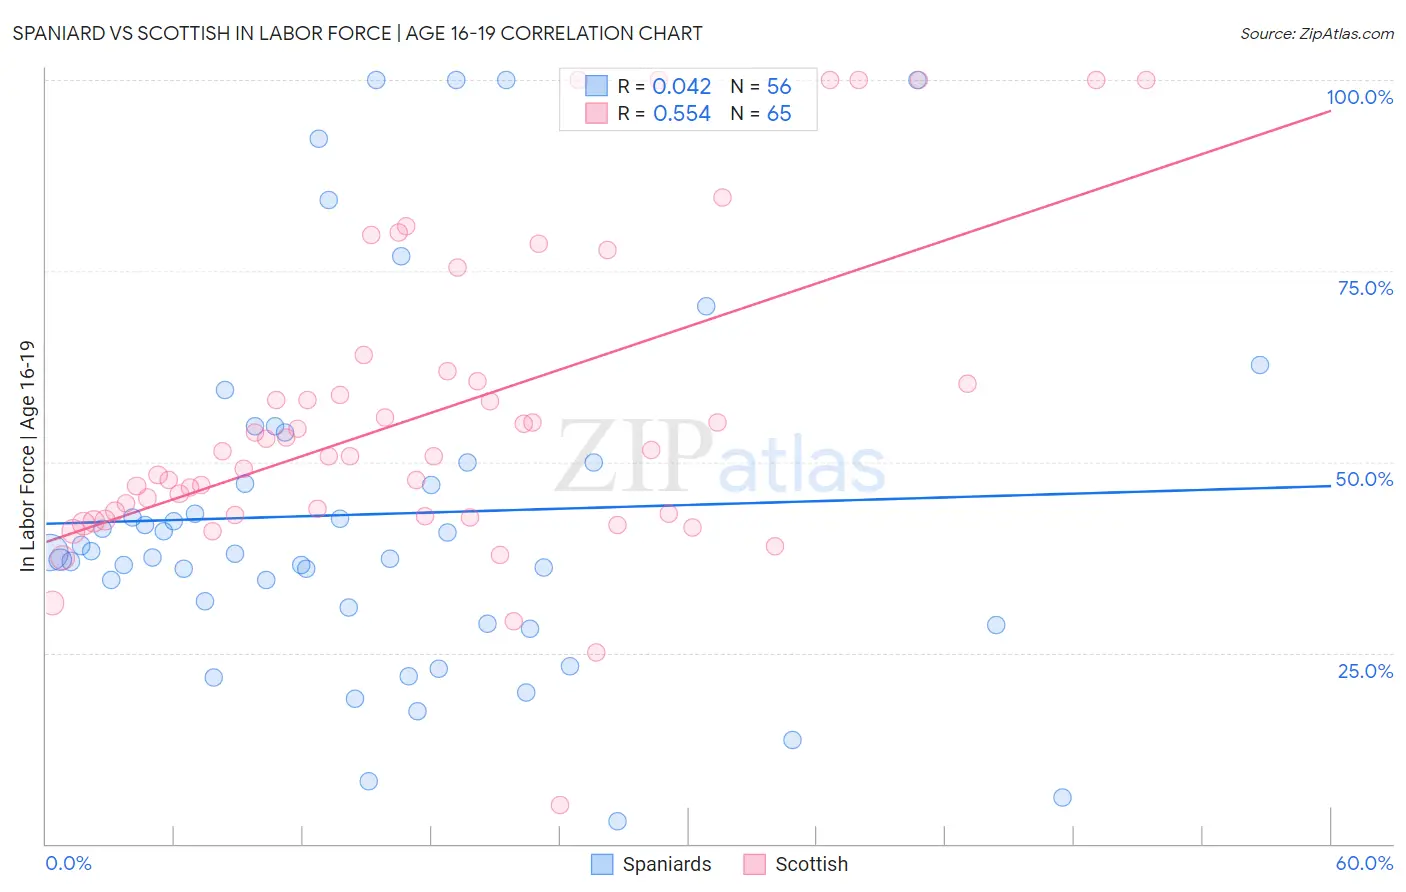
Spaniard vs Scottish In Labor Force | Age 16-19 Correlation Chart
The statistical analysis conducted on geographies consisting of 442,456,535 people shows no correlation between the proportion of Spaniards and labor force participation rate among population between the ages 16 and 19 in the United States with a correlation coefficient (R) of 0.042 and weighted average of 38.0%. Similarly, the statistical analysis conducted on geographies consisting of 562,983,292 people shows a substantial positive correlation between the proportion of Scottish and labor force participation rate among population between the ages 16 and 19 in the United States with a correlation coefficient (R) of 0.554 and weighted average of 42.0%, a difference of 10.6%.
In Labor Force | Age 16-19 Correlation Summary
| Measurement | Spaniard | Scottish |
| Minimum | 3.0% | 5.0% |
| Maximum | 100.0% | 100.0% |
| Range | 97.0% | 95.0% |
| Mean | 43.2% | 56.2% |
| Median | 38.1% | 50.8% |
| Interquartile 25% (IQ1) | 29.9% | 42.9% |
| Interquartile 75% (IQ3) | 50.0% | 61.2% |
| Interquartile Range (IQR) | 20.1% | 18.3% |
| Standard Deviation (Sample) | 23.4% | 20.5% |
| Standard Deviation (Population) | 23.2% | 20.4% |
Similar Demographics by In Labor Force | Age 16-19
Demographics Similar to Spaniards by In Labor Force | Age 16-19
In terms of in labor force | age 16-19, the demographic groups most similar to Spaniards are New Zealander (38.0%, a difference of 0.020%), African (38.0%, a difference of 0.030%), Choctaw (38.0%, a difference of 0.030%), Immigrants from Zimbabwe (38.0%, a difference of 0.030%), and Immigrants from Austria (37.9%, a difference of 0.12%).
| Demographics | Rating | Rank | In Labor Force | Age 16-19 |
| Guamanians/Chamorros | 97.4 /100 | #122 | Exceptional 38.2% |
| Seminole | 96.7 /100 | #123 | Exceptional 38.1% |
| Immigrants | England | 96.4 /100 | #124 | Exceptional 38.1% |
| Immigrants | Africa | 96.1 /100 | #125 | Exceptional 38.0% |
| Africans | 95.6 /100 | #126 | Exceptional 38.0% |
| Choctaw | 95.6 /100 | #127 | Exceptional 38.0% |
| New Zealanders | 95.6 /100 | #128 | Exceptional 38.0% |
| Spaniards | 95.5 /100 | #129 | Exceptional 38.0% |
| Immigrants | Zimbabwe | 95.4 /100 | #130 | Exceptional 38.0% |
| Immigrants | Austria | 95.0 /100 | #131 | Exceptional 37.9% |
| Immigrants | Oceania | 94.7 /100 | #132 | Exceptional 37.9% |
| Cheyenne | 94.6 /100 | #133 | Exceptional 37.9% |
| Immigrants | Netherlands | 93.7 /100 | #134 | Exceptional 37.8% |
| Macedonians | 93.4 /100 | #135 | Exceptional 37.8% |
| Australians | 93.2 /100 | #136 | Exceptional 37.8% |
Demographics Similar to Scottish by In Labor Force | Age 16-19
In terms of in labor force | age 16-19, the demographic groups most similar to Scottish are Irish (42.0%, a difference of 0.070%), Czechoslovakian (41.9%, a difference of 0.27%), French (42.1%, a difference of 0.28%), Polish (42.1%, a difference of 0.33%), and Liberian (41.8%, a difference of 0.41%).
| Demographics | Rating | Rank | In Labor Force | Age 16-19 |
| Slovaks | 100.0 /100 | #23 | Exceptional 42.6% |
| Bangladeshis | 100.0 /100 | #24 | Exceptional 42.5% |
| German Russians | 100.0 /100 | #25 | Exceptional 42.4% |
| English | 100.0 /100 | #26 | Exceptional 42.4% |
| Welsh | 100.0 /100 | #27 | Exceptional 42.3% |
| Poles | 100.0 /100 | #28 | Exceptional 42.1% |
| French | 100.0 /100 | #29 | Exceptional 42.1% |
| Scottish | 100.0 /100 | #30 | Exceptional 42.0% |
| Irish | 100.0 /100 | #31 | Exceptional 42.0% |
| Czechoslovakians | 100.0 /100 | #32 | Exceptional 41.9% |
| Liberians | 100.0 /100 | #33 | Exceptional 41.8% |
| Immigrants | Bosnia and Herzegovina | 100.0 /100 | #34 | Exceptional 41.8% |
| Yugoslavians | 100.0 /100 | #35 | Exceptional 41.8% |
| Immigrants | Azores | 100.0 /100 | #36 | Exceptional 41.7% |
| Immigrants | Congo | 100.0 /100 | #37 | Exceptional 41.7% |