French American Indian vs Immigrants from South Eastern Asia In Labor Force | Age 16-19
COMPARE
French American Indian
Immigrants from South Eastern Asia
In Labor Force | Age 16-19
In Labor Force | Age 16-19 Comparison
French American Indians
Immigrants from South Eastern Asia
39.8%
IN LABOR FORCE | AGE 16-19
99.9/ 100
METRIC RATING
75th/ 347
METRIC RANK
35.6%
IN LABOR FORCE | AGE 16-19
10.8/ 100
METRIC RATING
215th/ 347
METRIC RANK
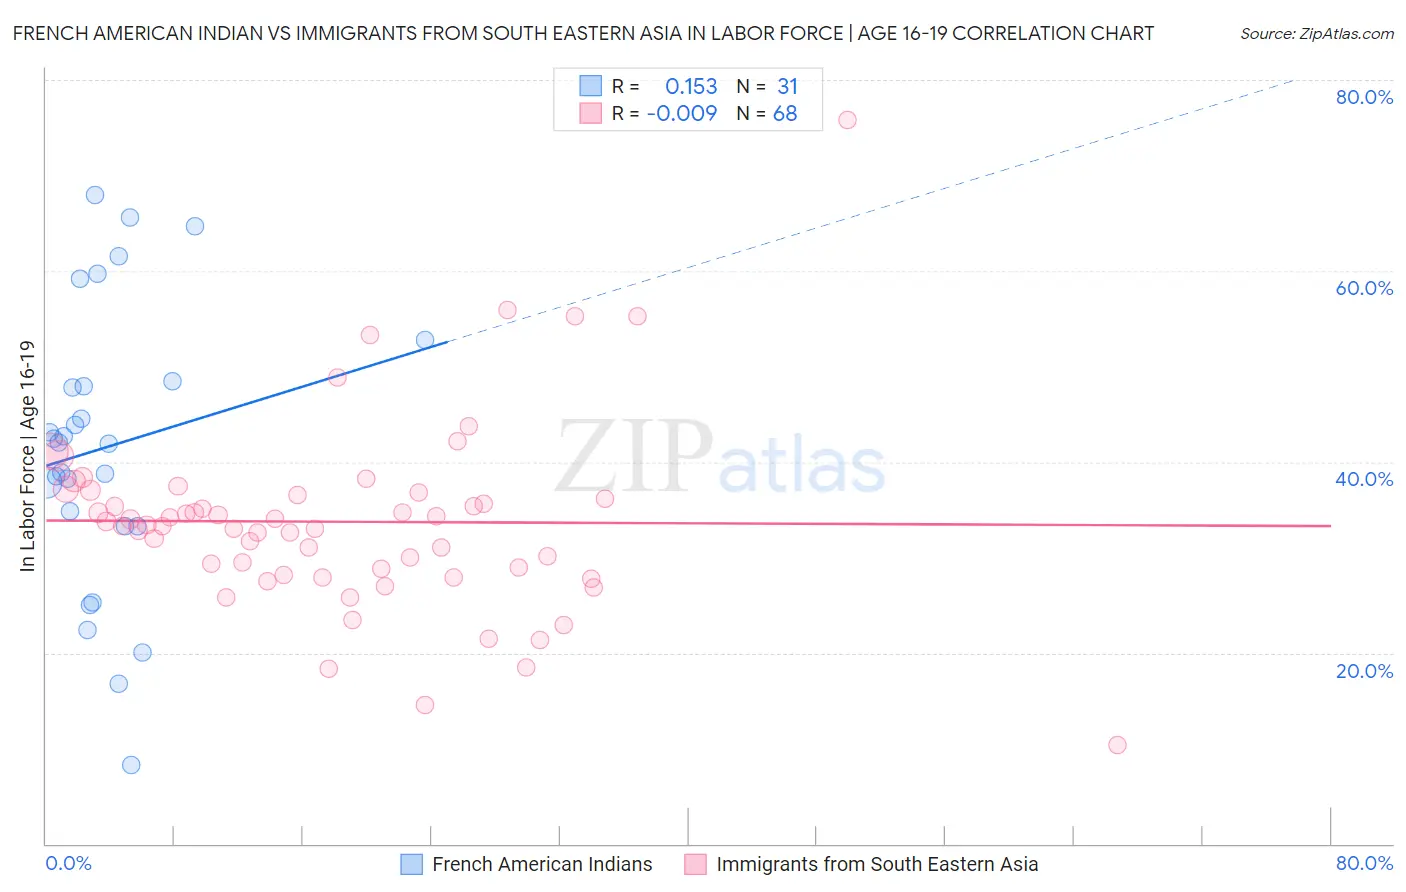
French American Indian vs Immigrants from South Eastern Asia In Labor Force | Age 16-19 Correlation Chart
The statistical analysis conducted on geographies consisting of 131,885,422 people shows a poor positive correlation between the proportion of French American Indians and labor force participation rate among population between the ages 16 and 19 in the United States with a correlation coefficient (R) of 0.153 and weighted average of 39.8%. Similarly, the statistical analysis conducted on geographies consisting of 511,227,772 people shows no correlation between the proportion of Immigrants from South Eastern Asia and labor force participation rate among population between the ages 16 and 19 in the United States with a correlation coefficient (R) of -0.009 and weighted average of 35.6%, a difference of 11.9%.
In Labor Force | Age 16-19 Correlation Summary
| Measurement | French American Indian | Immigrants from South Eastern Asia |
| Minimum | 8.2% | 10.4% |
| Maximum | 68.0% | 75.8% |
| Range | 59.8% | 65.4% |
| Mean | 41.5% | 33.7% |
| Median | 42.0% | 33.3% |
| Interquartile 25% (IQ1) | 33.3% | 28.5% |
| Interquartile 75% (IQ3) | 48.4% | 36.6% |
| Interquartile Range (IQR) | 15.1% | 8.1% |
| Standard Deviation (Sample) | 14.7% | 10.0% |
| Standard Deviation (Population) | 14.4% | 9.9% |
Similar Demographics by In Labor Force | Age 16-19
Demographics Similar to French American Indians by In Labor Force | Age 16-19
In terms of in labor force | age 16-19, the demographic groups most similar to French American Indians are Hungarian (39.8%, a difference of 0.020%), Immigrants from Middle Africa (39.9%, a difference of 0.25%), Malaysian (39.7%, a difference of 0.27%), Serbian (39.9%, a difference of 0.29%), and Iroquois (39.9%, a difference of 0.29%).
| Demographics | Rating | Rank | In Labor Force | Age 16-19 |
| Italians | 99.9 /100 | #68 | Exceptional 40.1% |
| Potawatomi | 99.9 /100 | #69 | Exceptional 40.0% |
| Portuguese | 99.9 /100 | #70 | Exceptional 40.0% |
| Serbians | 99.9 /100 | #71 | Exceptional 39.9% |
| Iroquois | 99.9 /100 | #72 | Exceptional 39.9% |
| Immigrants | Middle Africa | 99.9 /100 | #73 | Exceptional 39.9% |
| Hungarians | 99.9 /100 | #74 | Exceptional 39.8% |
| French American Indians | 99.9 /100 | #75 | Exceptional 39.8% |
| Malaysians | 99.9 /100 | #76 | Exceptional 39.7% |
| Immigrants | Portugal | 99.9 /100 | #77 | Exceptional 39.7% |
| Austrians | 99.8 /100 | #78 | Exceptional 39.5% |
| Marshallese | 99.8 /100 | #79 | Exceptional 39.5% |
| Immigrants | Iraq | 99.8 /100 | #80 | Exceptional 39.4% |
| Shoshone | 99.7 /100 | #81 | Exceptional 39.3% |
| Basques | 99.7 /100 | #82 | Exceptional 39.3% |
Demographics Similar to Immigrants from South Eastern Asia by In Labor Force | Age 16-19
In terms of in labor force | age 16-19, the demographic groups most similar to Immigrants from South Eastern Asia are Apache (35.6%, a difference of 0.020%), Dutch West Indian (35.6%, a difference of 0.020%), Immigrants from Costa Rica (35.6%, a difference of 0.020%), Houma (35.6%, a difference of 0.030%), and Immigrants from Bolivia (35.6%, a difference of 0.030%).
| Demographics | Rating | Rank | In Labor Force | Age 16-19 |
| Koreans | 13.3 /100 | #208 | Poor 35.7% |
| Moroccans | 12.7 /100 | #209 | Poor 35.7% |
| Immigrants | Switzerland | 11.9 /100 | #210 | Poor 35.6% |
| Mexicans | 11.9 /100 | #211 | Poor 35.6% |
| Houma | 11.0 /100 | #212 | Poor 35.6% |
| Immigrants | Bolivia | 11.0 /100 | #213 | Poor 35.6% |
| Apache | 11.0 /100 | #214 | Poor 35.6% |
| Immigrants | South Eastern Asia | 10.8 /100 | #215 | Poor 35.6% |
| Dutch West Indians | 10.7 /100 | #216 | Poor 35.6% |
| Immigrants | Costa Rica | 10.7 /100 | #217 | Poor 35.6% |
| Sri Lankans | 9.8 /100 | #218 | Tragic 35.5% |
| Guatemalans | 8.6 /100 | #219 | Tragic 35.5% |
| Immigrants | Bahamas | 8.3 /100 | #220 | Tragic 35.5% |
| Turks | 7.3 /100 | #221 | Tragic 35.4% |
| Immigrants | Ghana | 7.3 /100 | #222 | Tragic 35.4% |