Immigrants from Mexico vs Lumbee In Labor Force | Age 20-24
COMPARE
Immigrants from Mexico
Lumbee
In Labor Force | Age 20-24
In Labor Force | Age 20-24 Comparison
Immigrants from Mexico
Lumbee
75.0%
IN LABOR FORCE | AGE 20-24
47.8/ 100
METRIC RATING
177th/ 347
METRIC RANK
65.5%
IN LABOR FORCE | AGE 20-24
0.0/ 100
METRIC RATING
346th/ 347
METRIC RANK
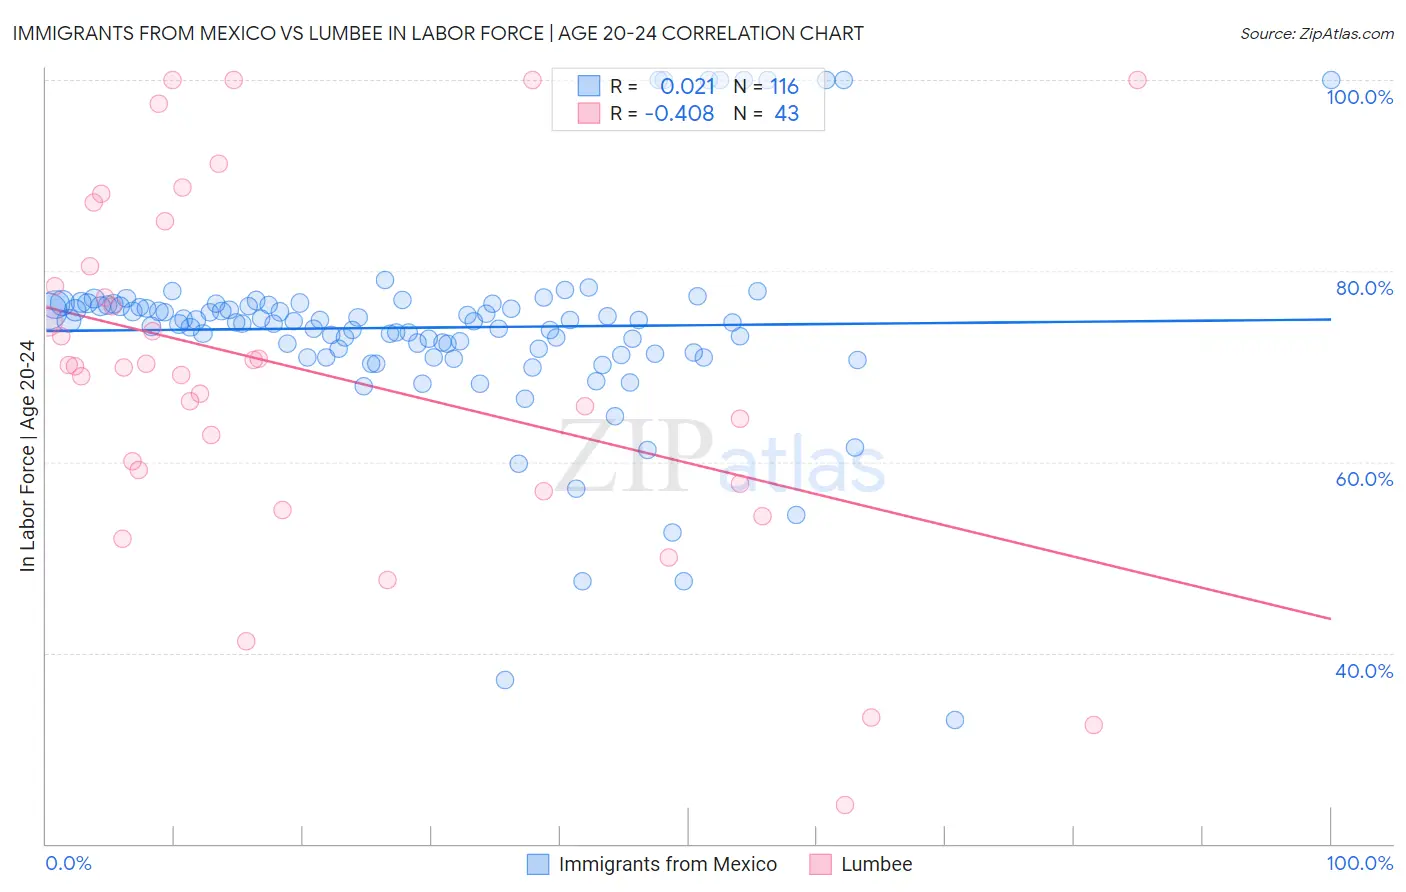
Immigrants from Mexico vs Lumbee In Labor Force | Age 20-24 Correlation Chart
The statistical analysis conducted on geographies consisting of 513,104,206 people shows no correlation between the proportion of Immigrants from Mexico and labor force participation rate among population between the ages 20 and 24 in the United States with a correlation coefficient (R) of 0.021 and weighted average of 75.0%. Similarly, the statistical analysis conducted on geographies consisting of 92,285,947 people shows a moderate negative correlation between the proportion of Lumbee and labor force participation rate among population between the ages 20 and 24 in the United States with a correlation coefficient (R) of -0.408 and weighted average of 65.5%, a difference of 14.5%.
In Labor Force | Age 20-24 Correlation Summary
| Measurement | Immigrants from Mexico | Lumbee |
| Minimum | 32.9% | 24.0% |
| Maximum | 100.0% | 100.0% |
| Range | 67.1% | 76.0% |
| Mean | 74.1% | 69.3% |
| Median | 74.7% | 70.0% |
| Interquartile 25% (IQ1) | 71.3% | 57.7% |
| Interquartile 75% (IQ3) | 76.4% | 80.5% |
| Interquartile Range (IQR) | 5.1% | 22.8% |
| Standard Deviation (Sample) | 10.6% | 18.5% |
| Standard Deviation (Population) | 10.6% | 18.3% |
Similar Demographics by In Labor Force | Age 20-24
Demographics Similar to Immigrants from Mexico by In Labor Force | Age 20-24
In terms of in labor force | age 20-24, the demographic groups most similar to Immigrants from Mexico are Central American (75.0%, a difference of 0.010%), Syrian (75.0%, a difference of 0.020%), Immigrants from Croatia (75.1%, a difference of 0.030%), South African (75.0%, a difference of 0.030%), and Yakama (75.1%, a difference of 0.040%).
| Demographics | Rating | Rank | In Labor Force | Age 20-24 |
| Mexicans | 52.1 /100 | #170 | Average 75.1% |
| Cajuns | 51.1 /100 | #171 | Average 75.1% |
| Yakama | 50.8 /100 | #172 | Average 75.1% |
| Immigrants | Croatia | 50.2 /100 | #173 | Average 75.1% |
| South Africans | 50.0 /100 | #174 | Average 75.0% |
| Syrians | 49.5 /100 | #175 | Average 75.0% |
| Central Americans | 48.7 /100 | #176 | Average 75.0% |
| Immigrants | Mexico | 47.8 /100 | #177 | Average 75.0% |
| Immigrants | Central America | 45.0 /100 | #178 | Average 75.0% |
| Immigrants | Latvia | 44.1 /100 | #179 | Average 75.0% |
| Immigrants | Czechoslovakia | 44.0 /100 | #180 | Average 75.0% |
| Africans | 42.5 /100 | #181 | Average 75.0% |
| Immigrants | South Africa | 36.9 /100 | #182 | Fair 74.9% |
| Immigrants | Costa Rica | 36.7 /100 | #183 | Fair 74.9% |
| Immigrants | Hungary | 35.0 /100 | #184 | Fair 74.9% |
Demographics Similar to Lumbee by In Labor Force | Age 20-24
In terms of in labor force | age 20-24, the demographic groups most similar to Lumbee are Hopi (66.0%, a difference of 0.79%), Navajo (64.8%, a difference of 1.1%), Immigrants from Grenada (67.2%, a difference of 2.5%), Puerto Rican (68.3%, a difference of 4.3%), and Immigrants from St. Vincent and the Grenadines (68.4%, a difference of 4.4%).
| Demographics | Rating | Rank | In Labor Force | Age 20-24 |
| Yuman | 0.0 /100 | #333 | Tragic 70.3% |
| British West Indians | 0.0 /100 | #334 | Tragic 70.0% |
| Immigrants | Barbados | 0.0 /100 | #335 | Tragic 69.7% |
| Immigrants | Guyana | 0.0 /100 | #336 | Tragic 69.3% |
| Guyanese | 0.0 /100 | #337 | Tragic 69.2% |
| Pima | 0.0 /100 | #338 | Tragic 69.0% |
| Immigrants | Yemen | 0.0 /100 | #339 | Tragic 68.9% |
| Menominee | 0.0 /100 | #340 | Tragic 68.7% |
| Tohono O'odham | 0.0 /100 | #341 | Tragic 68.6% |
| Immigrants | St. Vincent and the Grenadines | 0.0 /100 | #342 | Tragic 68.4% |
| Puerto Ricans | 0.0 /100 | #343 | Tragic 68.3% |
| Immigrants | Grenada | 0.0 /100 | #344 | Tragic 67.2% |
| Hopi | 0.0 /100 | #345 | Tragic 66.0% |
| Lumbee | 0.0 /100 | #346 | Tragic 65.5% |
| Navajo | 0.0 /100 | #347 | Tragic 64.8% |