Fijian vs European In Labor Force | Age 16-19
COMPARE
Fijian
European
In Labor Force | Age 16-19
In Labor Force | Age 16-19 Comparison
Fijians
Europeans
40.4%
IN LABOR FORCE | AGE 16-19
100.0/ 100
METRIC RATING
56th/ 347
METRIC RANK
41.1%
IN LABOR FORCE | AGE 16-19
100.0/ 100
METRIC RATING
44th/ 347
METRIC RANK
Fijian vs European In Labor Force | Age 16-19 Correlation Chart
The statistical analysis conducted on geographies consisting of 55,922,250 people shows a weak positive correlation between the proportion of Fijians and labor force participation rate among population between the ages 16 and 19 in the United States with a correlation coefficient (R) of 0.288 and weighted average of 40.4%. Similarly, the statistical analysis conducted on geographies consisting of 558,493,487 people shows a moderate positive correlation between the proportion of Europeans and labor force participation rate among population between the ages 16 and 19 in the United States with a correlation coefficient (R) of 0.481 and weighted average of 41.1%, a difference of 1.7%.
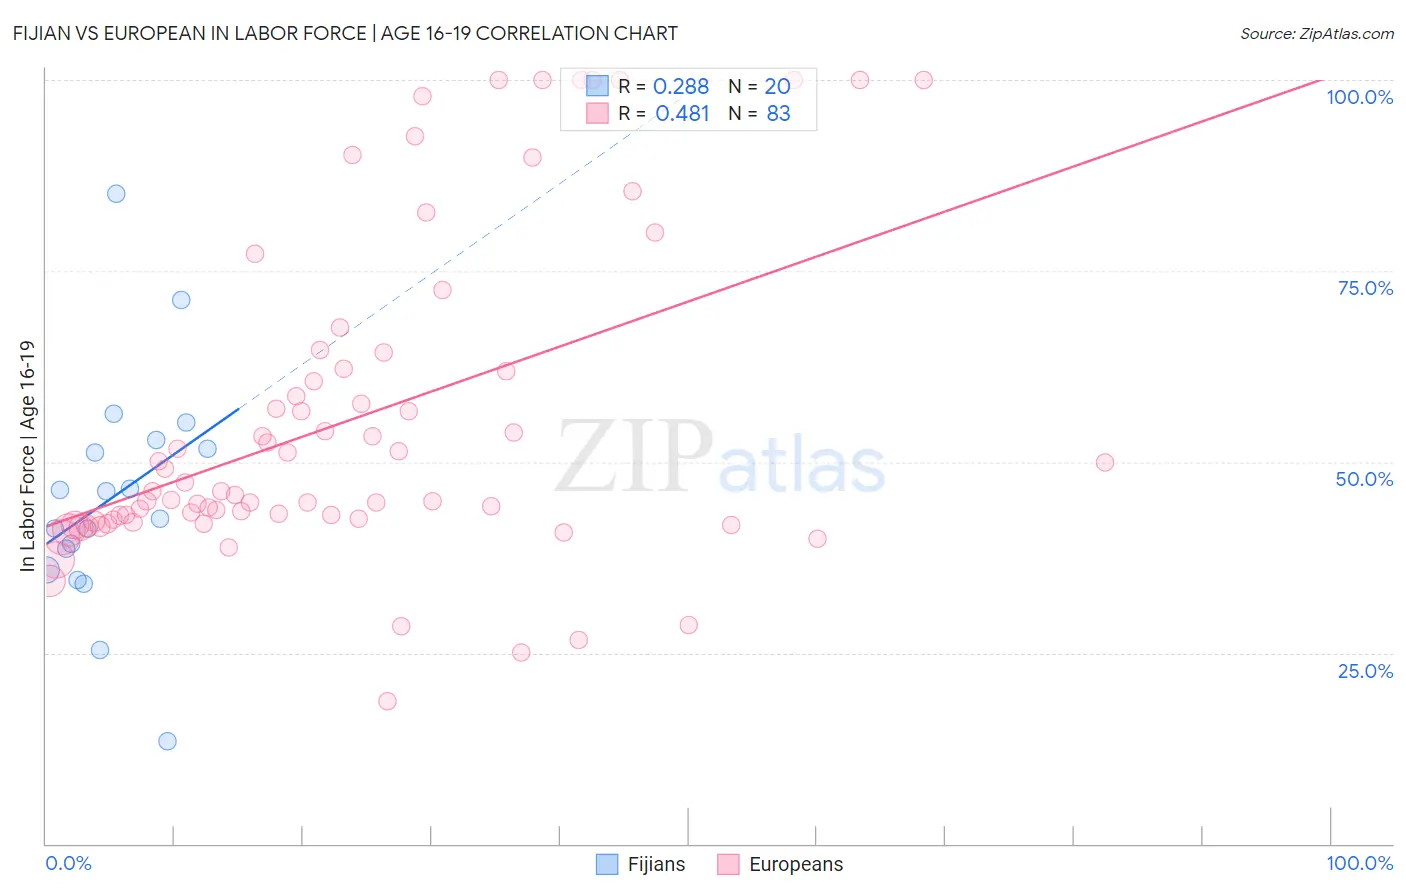
In Labor Force | Age 16-19 Correlation Summary
| Measurement | Fijian | European |
| Minimum | 13.4% | 18.6% |
| Maximum | 85.1% | 100.0% |
| Range | 71.7% | 81.4% |
| Mean | 45.4% | 55.4% |
| Median | 44.4% | 46.1% |
| Interquartile 25% (IQ1) | 37.2% | 42.3% |
| Interquartile 75% (IQ3) | 52.2% | 62.2% |
| Interquartile Range (IQR) | 15.0% | 20.0% |
| Standard Deviation (Sample) | 15.4% | 21.0% |
| Standard Deviation (Population) | 15.0% | 20.9% |
Demographics Similar to Fijians and Europeans by In Labor Force | Age 16-19
In terms of in labor force | age 16-19, the demographic groups most similar to Fijians are Lithuanian (40.4%, a difference of 0.030%), Aleut (40.4%, a difference of 0.040%), British (40.5%, a difference of 0.090%), Tlingit-Haida (40.5%, a difference of 0.12%), and Immigrants from Kenya (40.5%, a difference of 0.15%). Similarly, the demographic groups most similar to Europeans are Croatian (41.1%, a difference of 0.040%), Tongan (41.2%, a difference of 0.10%), Immigrants from Sudan (41.0%, a difference of 0.36%), White/Caucasian (41.3%, a difference of 0.41%), and Celtic (41.3%, a difference of 0.42%).
| Demographics | Rating | Rank | In Labor Force | Age 16-19 |
| Immigrants | Liberia | 100.0 /100 | #40 | Exceptional 41.5% |
| Celtics | 100.0 /100 | #41 | Exceptional 41.3% |
| Whites/Caucasians | 100.0 /100 | #42 | Exceptional 41.3% |
| Tongans | 100.0 /100 | #43 | Exceptional 41.2% |
| Europeans | 100.0 /100 | #44 | Exceptional 41.1% |
| Croatians | 100.0 /100 | #45 | Exceptional 41.1% |
| Immigrants | Sudan | 100.0 /100 | #46 | Exceptional 41.0% |
| Carpatho Rusyns | 100.0 /100 | #47 | Exceptional 40.8% |
| Icelanders | 100.0 /100 | #48 | Exceptional 40.8% |
| Cree | 100.0 /100 | #49 | Exceptional 40.8% |
| Indonesians | 100.0 /100 | #50 | Exceptional 40.7% |
| Immigrants | Zaire | 100.0 /100 | #51 | Exceptional 40.7% |
| Immigrants | Laos | 100.0 /100 | #52 | Exceptional 40.6% |
| Immigrants | Kenya | 100.0 /100 | #53 | Exceptional 40.5% |
| Tlingit-Haida | 100.0 /100 | #54 | Exceptional 40.5% |
| British | 100.0 /100 | #55 | Exceptional 40.5% |
| Fijians | 100.0 /100 | #56 | Exceptional 40.4% |
| Lithuanians | 100.0 /100 | #57 | Exceptional 40.4% |
| Aleuts | 100.0 /100 | #58 | Exceptional 40.4% |
| Slavs | 100.0 /100 | #59 | Exceptional 40.4% |
| Immigrants | Eastern Africa | 100.0 /100 | #60 | Exceptional 40.4% |