Fijian vs Immigrants from Brazil In Labor Force | Age 16-19
COMPARE
Fijian
Immigrants from Brazil
In Labor Force | Age 16-19
In Labor Force | Age 16-19 Comparison
Fijians
Immigrants from Brazil
40.4%
IN LABOR FORCE | AGE 16-19
100.0/ 100
METRIC RATING
56th/ 347
METRIC RANK
37.1%
IN LABOR FORCE | AGE 16-19
76.5/ 100
METRIC RATING
157th/ 347
METRIC RANK
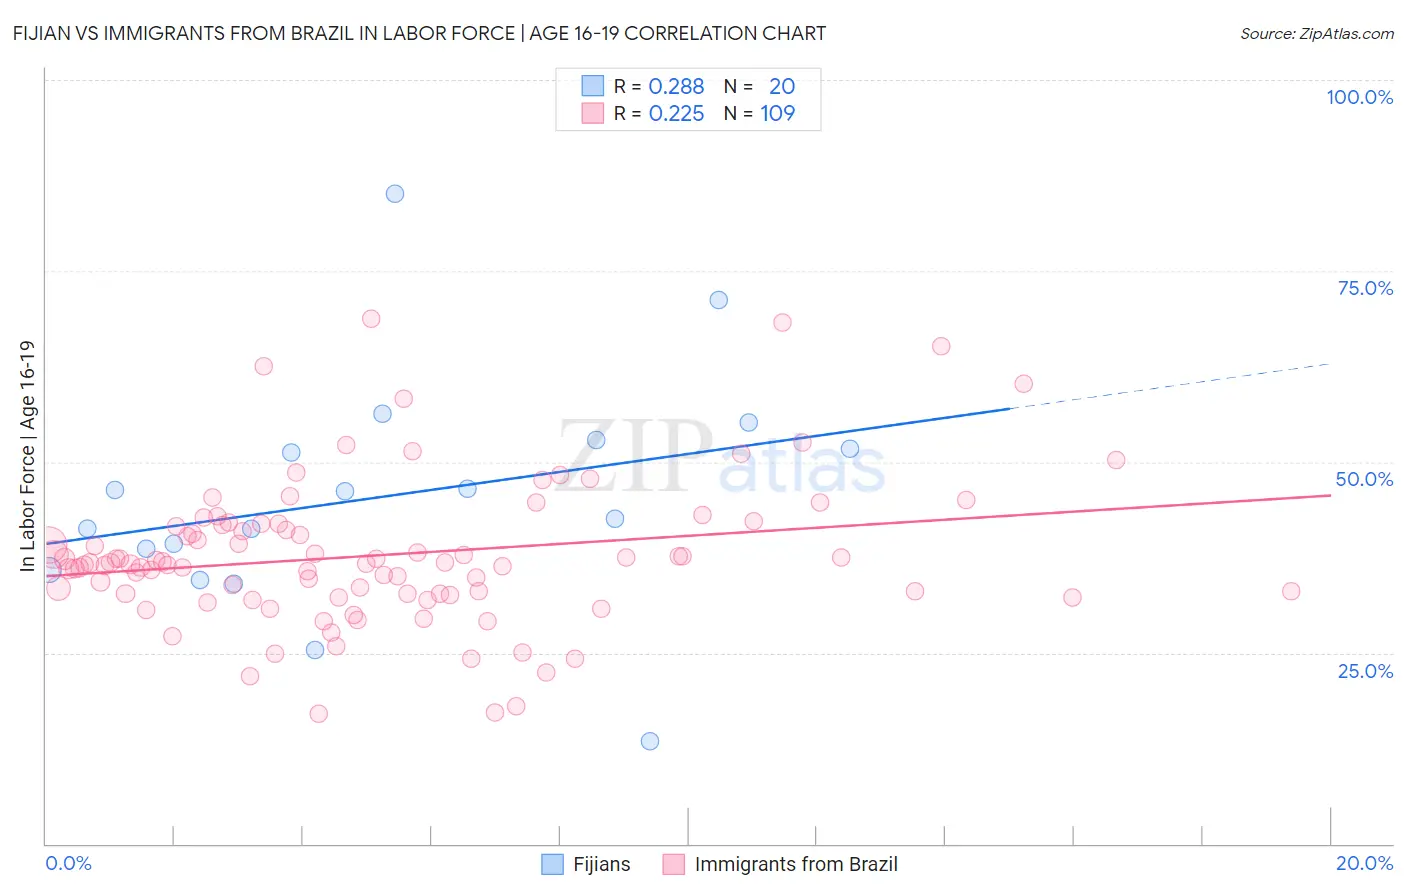
Fijian vs Immigrants from Brazil In Labor Force | Age 16-19 Correlation Chart
The statistical analysis conducted on geographies consisting of 55,922,250 people shows a weak positive correlation between the proportion of Fijians and labor force participation rate among population between the ages 16 and 19 in the United States with a correlation coefficient (R) of 0.288 and weighted average of 40.4%. Similarly, the statistical analysis conducted on geographies consisting of 342,618,647 people shows a weak positive correlation between the proportion of Immigrants from Brazil and labor force participation rate among population between the ages 16 and 19 in the United States with a correlation coefficient (R) of 0.225 and weighted average of 37.1%, a difference of 9.0%.
In Labor Force | Age 16-19 Correlation Summary
| Measurement | Fijian | Immigrants from Brazil |
| Minimum | 13.4% | 17.1% |
| Maximum | 85.1% | 68.8% |
| Range | 71.7% | 51.7% |
| Mean | 45.4% | 37.8% |
| Median | 44.4% | 36.7% |
| Interquartile 25% (IQ1) | 37.2% | 32.7% |
| Interquartile 75% (IQ3) | 52.2% | 41.8% |
| Interquartile Range (IQR) | 15.0% | 9.1% |
| Standard Deviation (Sample) | 15.4% | 9.5% |
| Standard Deviation (Population) | 15.0% | 9.5% |
Similar Demographics by In Labor Force | Age 16-19
Demographics Similar to Fijians by In Labor Force | Age 16-19
In terms of in labor force | age 16-19, the demographic groups most similar to Fijians are Lithuanian (40.4%, a difference of 0.030%), Aleut (40.4%, a difference of 0.040%), British (40.5%, a difference of 0.090%), Tlingit-Haida (40.5%, a difference of 0.12%), and Immigrants from Kenya (40.5%, a difference of 0.15%).
| Demographics | Rating | Rank | In Labor Force | Age 16-19 |
| Cree | 100.0 /100 | #49 | Exceptional 40.8% |
| Indonesians | 100.0 /100 | #50 | Exceptional 40.7% |
| Immigrants | Zaire | 100.0 /100 | #51 | Exceptional 40.7% |
| Immigrants | Laos | 100.0 /100 | #52 | Exceptional 40.6% |
| Immigrants | Kenya | 100.0 /100 | #53 | Exceptional 40.5% |
| Tlingit-Haida | 100.0 /100 | #54 | Exceptional 40.5% |
| British | 100.0 /100 | #55 | Exceptional 40.5% |
| Fijians | 100.0 /100 | #56 | Exceptional 40.4% |
| Lithuanians | 100.0 /100 | #57 | Exceptional 40.4% |
| Aleuts | 100.0 /100 | #58 | Exceptional 40.4% |
| Slavs | 100.0 /100 | #59 | Exceptional 40.4% |
| Immigrants | Eastern Africa | 100.0 /100 | #60 | Exceptional 40.4% |
| Americans | 100.0 /100 | #61 | Exceptional 40.3% |
| Cherokee | 100.0 /100 | #62 | Exceptional 40.2% |
| Northern Europeans | 100.0 /100 | #63 | Exceptional 40.2% |
Demographics Similar to Immigrants from Brazil by In Labor Force | Age 16-19
In terms of in labor force | age 16-19, the demographic groups most similar to Immigrants from Brazil are Ute (37.1%, a difference of 0.050%), Yaqui (37.1%, a difference of 0.14%), Immigrants from Saudi Arabia (37.0%, a difference of 0.17%), Kiowa (37.2%, a difference of 0.29%), and Immigrants from Lithuania (37.2%, a difference of 0.31%).
| Demographics | Rating | Rank | In Labor Force | Age 16-19 |
| Tsimshian | 84.7 /100 | #150 | Excellent 37.4% |
| Immigrants | Poland | 84.4 /100 | #151 | Excellent 37.3% |
| Immigrants | Sierra Leone | 83.6 /100 | #152 | Excellent 37.3% |
| Arapaho | 81.8 /100 | #153 | Excellent 37.3% |
| Immigrants | Bulgaria | 81.6 /100 | #154 | Excellent 37.3% |
| Immigrants | Lithuania | 80.7 /100 | #155 | Excellent 37.2% |
| Kiowa | 80.4 /100 | #156 | Excellent 37.2% |
| Immigrants | Brazil | 76.5 /100 | #157 | Good 37.1% |
| Ute | 75.7 /100 | #158 | Good 37.1% |
| Yaqui | 74.4 /100 | #159 | Good 37.1% |
| Immigrants | Saudi Arabia | 73.9 /100 | #160 | Good 37.0% |
| Cambodians | 71.5 /100 | #161 | Good 37.0% |
| Immigrants | Jordan | 69.5 /100 | #162 | Good 36.9% |
| Bermudans | 69.3 /100 | #163 | Good 36.9% |
| Immigrants | Kuwait | 68.9 /100 | #164 | Good 36.9% |