Finnish vs Indonesian In Labor Force | Age 35-44
COMPARE
Finnish
Indonesian
In Labor Force | Age 35-44
In Labor Force | Age 35-44 Comparison
Finns
Indonesians
84.7%
IN LABOR FORCE | AGE 35-44
91.2/ 100
METRIC RATING
121st/ 347
METRIC RANK
83.7%
IN LABOR FORCE | AGE 35-44
0.8/ 100
METRIC RATING
248th/ 347
METRIC RANK
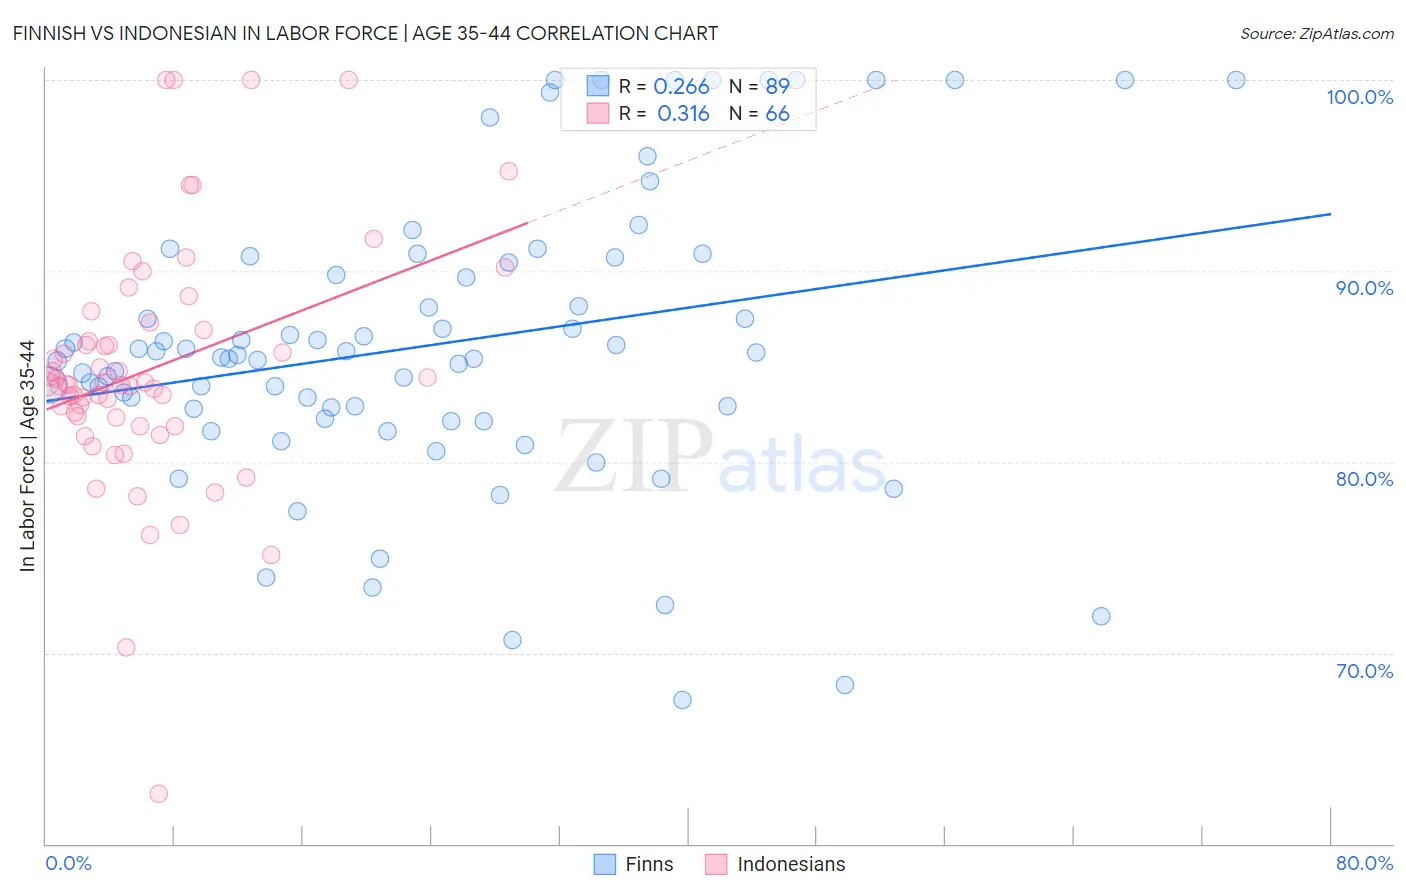
Finnish vs Indonesian In Labor Force | Age 35-44 Correlation Chart
The statistical analysis conducted on geographies consisting of 404,525,651 people shows a weak positive correlation between the proportion of Finns and labor force participation rate among population between the ages 35 and 44 in the United States with a correlation coefficient (R) of 0.266 and weighted average of 84.7%. Similarly, the statistical analysis conducted on geographies consisting of 162,640,915 people shows a mild positive correlation between the proportion of Indonesians and labor force participation rate among population between the ages 35 and 44 in the United States with a correlation coefficient (R) of 0.316 and weighted average of 83.7%, a difference of 1.2%.
In Labor Force | Age 35-44 Correlation Summary
| Measurement | Finnish | Indonesian |
| Minimum | 67.5% | 62.6% |
| Maximum | 100.0% | 100.0% |
| Range | 32.5% | 37.4% |
| Mean | 86.2% | 84.8% |
| Median | 85.6% | 84.1% |
| Interquartile 25% (IQ1) | 82.5% | 82.3% |
| Interquartile 75% (IQ3) | 90.6% | 86.9% |
| Interquartile Range (IQR) | 8.1% | 4.6% |
| Standard Deviation (Sample) | 7.5% | 6.4% |
| Standard Deviation (Population) | 7.5% | 6.4% |
Similar Demographics by In Labor Force | Age 35-44
Demographics Similar to Finns by In Labor Force | Age 35-44
In terms of in labor force | age 35-44, the demographic groups most similar to Finns are German (84.7%, a difference of 0.0%), Immigrants from South America (84.7%, a difference of 0.0%), Burmese (84.7%, a difference of 0.010%), Immigrants from Northern Europe (84.7%, a difference of 0.010%), and Slavic (84.7%, a difference of 0.010%).
| Demographics | Rating | Rank | In Labor Force | Age 35-44 |
| Chileans | 93.2 /100 | #114 | Exceptional 84.7% |
| Bahamians | 93.2 /100 | #115 | Exceptional 84.7% |
| Immigrants | Egypt | 92.7 /100 | #116 | Exceptional 84.7% |
| Immigrants | China | 92.3 /100 | #117 | Exceptional 84.7% |
| Immigrants | Eastern Asia | 92.1 /100 | #118 | Exceptional 84.7% |
| Burmese | 91.8 /100 | #119 | Exceptional 84.7% |
| Immigrants | Northern Europe | 91.5 /100 | #120 | Exceptional 84.7% |
| Finns | 91.2 /100 | #121 | Exceptional 84.7% |
| Germans | 91.0 /100 | #122 | Exceptional 84.7% |
| Immigrants | South America | 90.9 /100 | #123 | Exceptional 84.7% |
| Slavs | 90.8 /100 | #124 | Exceptional 84.7% |
| Maltese | 90.8 /100 | #125 | Exceptional 84.7% |
| Asians | 90.6 /100 | #126 | Exceptional 84.7% |
| Immigrants | Spain | 90.6 /100 | #127 | Exceptional 84.7% |
| Immigrants | Ghana | 90.4 /100 | #128 | Exceptional 84.7% |
Demographics Similar to Indonesians by In Labor Force | Age 35-44
In terms of in labor force | age 35-44, the demographic groups most similar to Indonesians are Immigrants from Armenia (83.7%, a difference of 0.020%), Immigrants (83.7%, a difference of 0.030%), Immigrants from St. Vincent and the Grenadines (83.7%, a difference of 0.030%), Immigrants from Cambodia (83.8%, a difference of 0.050%), and Immigrants from Western Asia (83.8%, a difference of 0.050%).
| Demographics | Rating | Rank | In Labor Force | Age 35-44 |
| Iraqis | 1.3 /100 | #241 | Tragic 83.8% |
| Immigrants | Cambodia | 1.1 /100 | #242 | Tragic 83.8% |
| Immigrants | Western Asia | 1.1 /100 | #243 | Tragic 83.8% |
| Guyanese | 1.1 /100 | #244 | Tragic 83.8% |
| Malaysians | 1.1 /100 | #245 | Tragic 83.8% |
| Immigrants | Immigrants | 1.0 /100 | #246 | Tragic 83.7% |
| Immigrants | Armenia | 0.9 /100 | #247 | Tragic 83.7% |
| Indonesians | 0.8 /100 | #248 | Tragic 83.7% |
| Immigrants | St. Vincent and the Grenadines | 0.7 /100 | #249 | Tragic 83.7% |
| Whites/Caucasians | 0.5 /100 | #250 | Tragic 83.6% |
| Salvadorans | 0.4 /100 | #251 | Tragic 83.6% |
| Immigrants | Guyana | 0.4 /100 | #252 | Tragic 83.6% |
| Lebanese | 0.4 /100 | #253 | Tragic 83.6% |
| Tongans | 0.4 /100 | #254 | Tragic 83.6% |
| Immigrants | Azores | 0.3 /100 | #255 | Tragic 83.6% |