Spanish American vs Immigrants from Honduras In Labor Force | Age 20-64
COMPARE
Spanish American
Immigrants from Honduras
In Labor Force | Age 20-64
In Labor Force | Age 20-64 Comparison
Spanish Americans
Immigrants from Honduras
77.8%
IN LABOR FORCE | AGE 20-64
0.0/ 100
METRIC RATING
291st/ 347
METRIC RANK
78.7%
IN LABOR FORCE | AGE 20-64
0.6/ 100
METRIC RATING
252nd/ 347
METRIC RANK
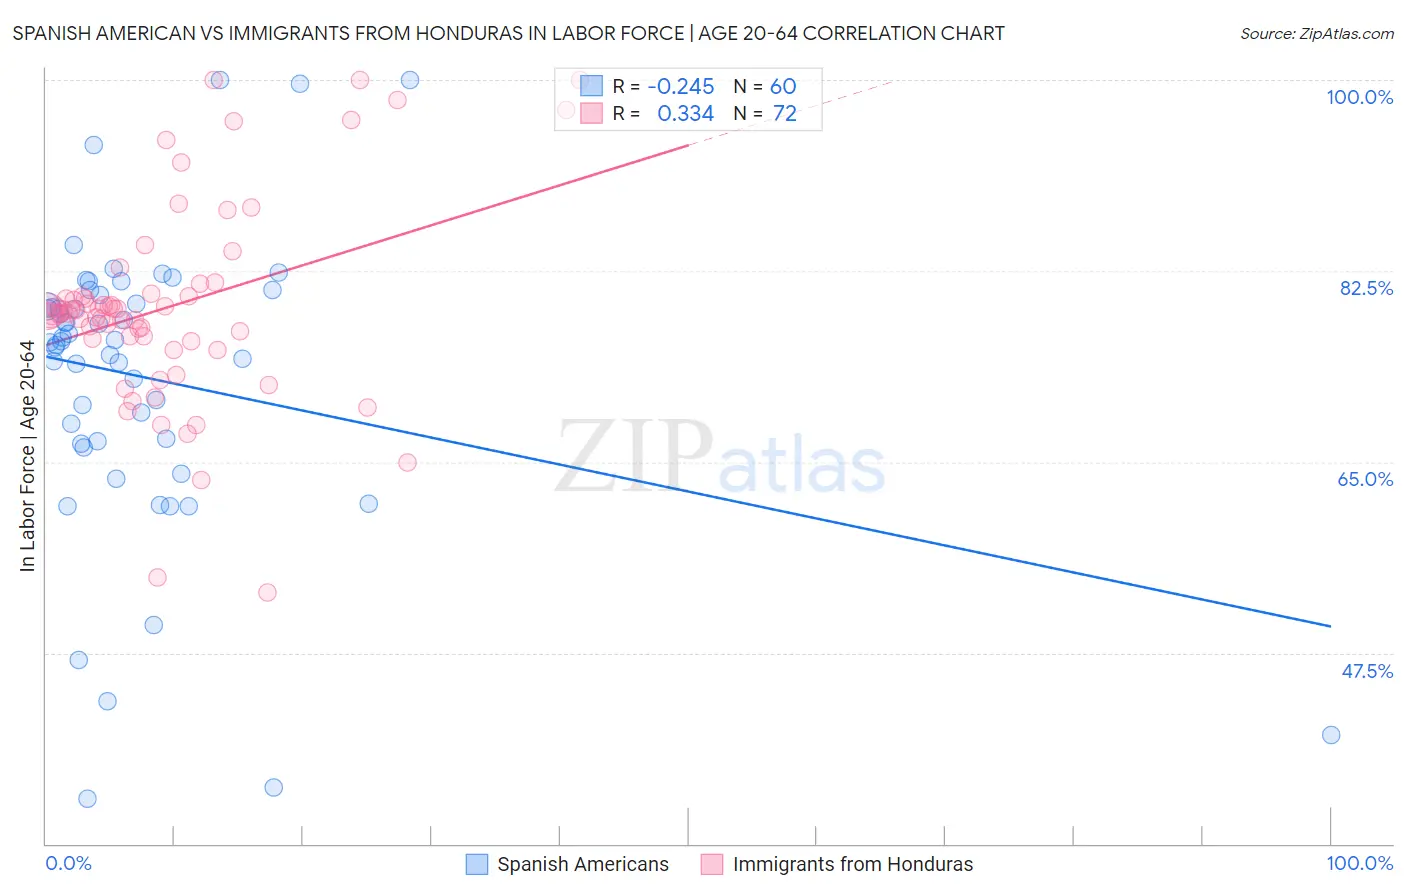
Spanish American vs Immigrants from Honduras In Labor Force | Age 20-64 Correlation Chart
The statistical analysis conducted on geographies consisting of 103,168,407 people shows a weak negative correlation between the proportion of Spanish Americans and labor force participation rate among population between the ages 20 and 64 in the United States with a correlation coefficient (R) of -0.245 and weighted average of 77.8%. Similarly, the statistical analysis conducted on geographies consisting of 322,602,752 people shows a mild positive correlation between the proportion of Immigrants from Honduras and labor force participation rate among population between the ages 20 and 64 in the United States with a correlation coefficient (R) of 0.334 and weighted average of 78.7%, a difference of 1.1%.
In Labor Force | Age 20-64 Correlation Summary
| Measurement | Spanish American | Immigrants from Honduras |
| Minimum | 34.1% | 53.0% |
| Maximum | 100.0% | 100.0% |
| Range | 65.9% | 47.0% |
| Mean | 72.7% | 79.2% |
| Median | 76.0% | 78.7% |
| Interquartile 25% (IQ1) | 66.8% | 76.2% |
| Interquartile 75% (IQ3) | 79.9% | 80.3% |
| Interquartile Range (IQR) | 13.1% | 4.1% |
| Standard Deviation (Sample) | 13.8% | 9.2% |
| Standard Deviation (Population) | 13.6% | 9.2% |
Similar Demographics by In Labor Force | Age 20-64
Demographics Similar to Spanish Americans by In Labor Force | Age 20-64
In terms of in labor force | age 20-64, the demographic groups most similar to Spanish Americans are Immigrants from Bangladesh (77.9%, a difference of 0.050%), Immigrants from the Azores (77.8%, a difference of 0.050%), African (77.9%, a difference of 0.070%), Hmong (77.9%, a difference of 0.080%), and Delaware (77.8%, a difference of 0.090%).
| Demographics | Rating | Rank | In Labor Force | Age 20-64 |
| Immigrants | Guyana | 0.0 /100 | #284 | Tragic 78.1% |
| Osage | 0.0 /100 | #285 | Tragic 78.0% |
| Immigrants | Belize | 0.0 /100 | #286 | Tragic 78.0% |
| Vietnamese | 0.0 /100 | #287 | Tragic 78.0% |
| Hmong | 0.0 /100 | #288 | Tragic 77.9% |
| Africans | 0.0 /100 | #289 | Tragic 77.9% |
| Immigrants | Bangladesh | 0.0 /100 | #290 | Tragic 77.9% |
| Spanish Americans | 0.0 /100 | #291 | Tragic 77.8% |
| Immigrants | Azores | 0.0 /100 | #292 | Tragic 77.8% |
| Delaware | 0.0 /100 | #293 | Tragic 77.8% |
| Immigrants | Central America | 0.0 /100 | #294 | Tragic 77.7% |
| Immigrants | Grenada | 0.0 /100 | #295 | Tragic 77.7% |
| Immigrants | Dominican Republic | 0.0 /100 | #296 | Tragic 77.7% |
| Dominicans | 0.0 /100 | #297 | Tragic 77.7% |
| Cree | 0.0 /100 | #298 | Tragic 77.7% |
Demographics Similar to Immigrants from Honduras by In Labor Force | Age 20-64
In terms of in labor force | age 20-64, the demographic groups most similar to Immigrants from Honduras are Basque (78.7%, a difference of 0.010%), Immigrants from Lebanon (78.7%, a difference of 0.010%), Hawaiian (78.7%, a difference of 0.030%), Celtic (78.7%, a difference of 0.040%), and Barbadian (78.8%, a difference of 0.050%).
| Demographics | Rating | Rank | In Labor Force | Age 20-64 |
| Scottish | 1.3 /100 | #245 | Tragic 78.9% |
| Immigrants | Trinidad and Tobago | 1.1 /100 | #246 | Tragic 78.8% |
| Immigrants | Germany | 1.0 /100 | #247 | Tragic 78.8% |
| Immigrants | Caribbean | 1.0 /100 | #248 | Tragic 78.8% |
| English | 0.9 /100 | #249 | Tragic 78.8% |
| Hondurans | 0.8 /100 | #250 | Tragic 78.8% |
| Barbadians | 0.7 /100 | #251 | Tragic 78.8% |
| Immigrants | Honduras | 0.6 /100 | #252 | Tragic 78.7% |
| Basques | 0.5 /100 | #253 | Tragic 78.7% |
| Immigrants | Lebanon | 0.5 /100 | #254 | Tragic 78.7% |
| Hawaiians | 0.5 /100 | #255 | Tragic 78.7% |
| Celtics | 0.5 /100 | #256 | Tragic 78.7% |
| Guatemalans | 0.4 /100 | #257 | Tragic 78.7% |
| Immigrants | Guatemala | 0.4 /100 | #258 | Tragic 78.7% |
| Tsimshian | 0.4 /100 | #259 | Tragic 78.7% |