Immigrants from North America vs Immigrants from Honduras In Labor Force | Age 20-64
COMPARE
Immigrants from North America
Immigrants from Honduras
In Labor Force | Age 20-64
In Labor Force | Age 20-64 Comparison
Immigrants from North America
Immigrants from Honduras
79.0%
IN LABOR FORCE | AGE 20-64
2.9/ 100
METRIC RATING
237th/ 347
METRIC RANK
78.7%
IN LABOR FORCE | AGE 20-64
0.6/ 100
METRIC RATING
252nd/ 347
METRIC RANK
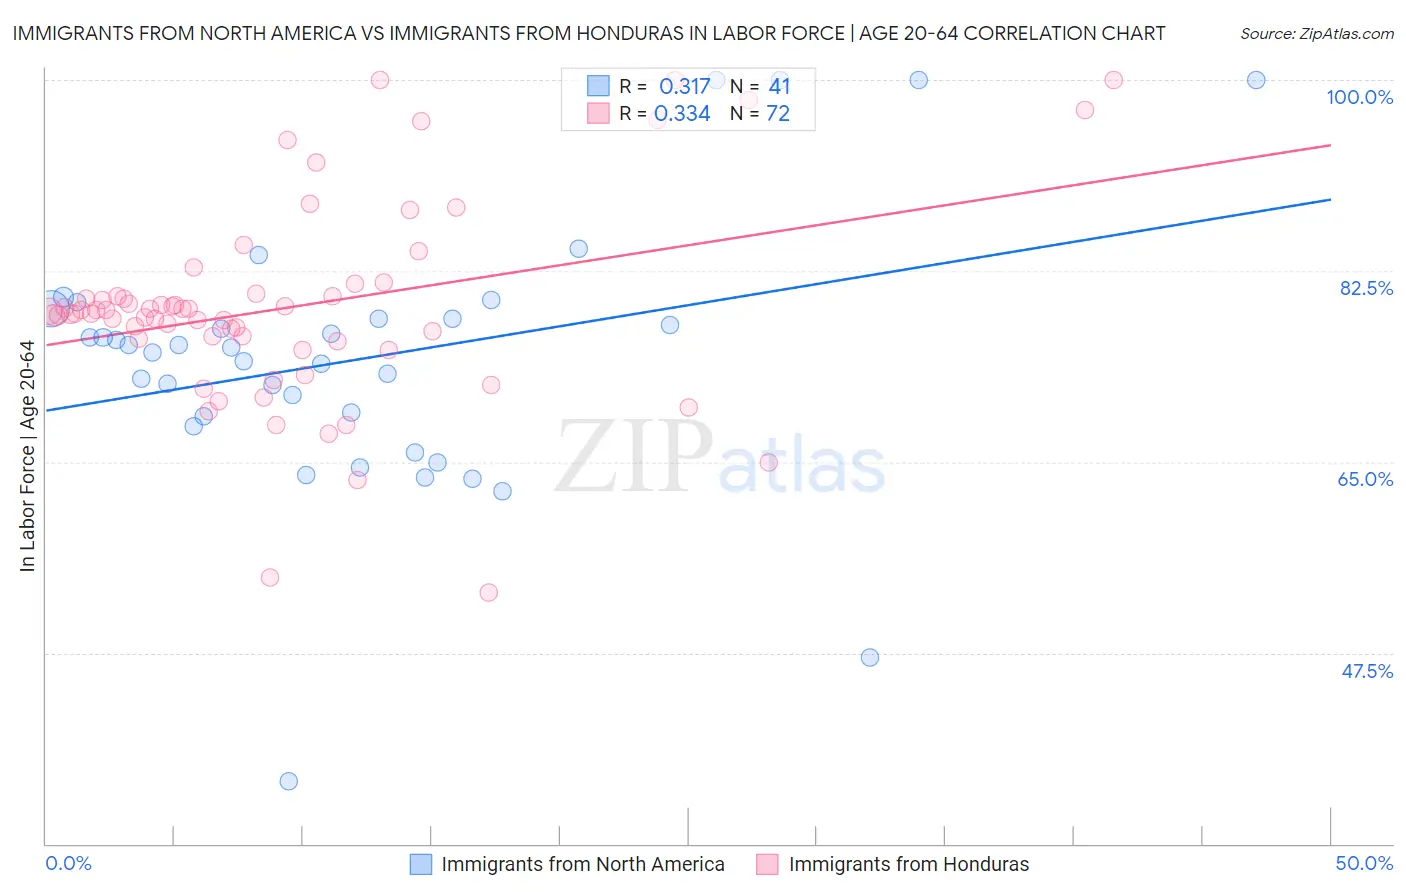
Immigrants from North America vs Immigrants from Honduras In Labor Force | Age 20-64 Correlation Chart
The statistical analysis conducted on geographies consisting of 462,473,604 people shows a mild positive correlation between the proportion of Immigrants from North America and labor force participation rate among population between the ages 20 and 64 in the United States with a correlation coefficient (R) of 0.317 and weighted average of 79.0%. Similarly, the statistical analysis conducted on geographies consisting of 322,602,752 people shows a mild positive correlation between the proportion of Immigrants from Honduras and labor force participation rate among population between the ages 20 and 64 in the United States with a correlation coefficient (R) of 0.334 and weighted average of 78.7%, a difference of 0.33%.
In Labor Force | Age 20-64 Correlation Summary
| Measurement | Immigrants from North America | Immigrants from Honduras |
| Minimum | 35.8% | 53.0% |
| Maximum | 100.0% | 100.0% |
| Range | 64.2% | 47.0% |
| Mean | 74.5% | 79.2% |
| Median | 75.5% | 78.7% |
| Interquartile 25% (IQ1) | 68.7% | 76.2% |
| Interquartile 75% (IQ3) | 78.6% | 80.3% |
| Interquartile Range (IQR) | 9.8% | 4.1% |
| Standard Deviation (Sample) | 12.3% | 9.2% |
| Standard Deviation (Population) | 12.2% | 9.2% |
Demographics Similar to Immigrants from North America and Immigrants from Honduras by In Labor Force | Age 20-64
In terms of in labor force | age 20-64, the demographic groups most similar to Immigrants from North America are Samoan (79.0%, a difference of 0.0%), Immigrants from Canada (79.0%, a difference of 0.020%), Tlingit-Haida (79.0%, a difference of 0.020%), Immigrants from Jamaica (79.0%, a difference of 0.020%), and Welsh (79.0%, a difference of 0.040%). Similarly, the demographic groups most similar to Immigrants from Honduras are Basque (78.7%, a difference of 0.010%), Immigrants from Lebanon (78.7%, a difference of 0.010%), Barbadian (78.8%, a difference of 0.050%), English (78.8%, a difference of 0.080%), and Honduran (78.8%, a difference of 0.080%).
| Demographics | Rating | Rank | In Labor Force | Age 20-64 |
| Immigrants | Canada | 3.2 /100 | #234 | Tragic 79.0% |
| Tlingit-Haida | 3.2 /100 | #235 | Tragic 79.0% |
| Samoans | 2.9 /100 | #236 | Tragic 79.0% |
| Immigrants | North America | 2.9 /100 | #237 | Tragic 79.0% |
| Immigrants | Jamaica | 2.6 /100 | #238 | Tragic 79.0% |
| Welsh | 2.4 /100 | #239 | Tragic 79.0% |
| Trinidadians and Tobagonians | 2.3 /100 | #240 | Tragic 79.0% |
| Jamaicans | 2.0 /100 | #241 | Tragic 78.9% |
| Immigrants | Micronesia | 1.9 /100 | #242 | Tragic 78.9% |
| Immigrants | West Indies | 1.7 /100 | #243 | Tragic 78.9% |
| French | 1.5 /100 | #244 | Tragic 78.9% |
| Scottish | 1.3 /100 | #245 | Tragic 78.9% |
| Immigrants | Trinidad and Tobago | 1.1 /100 | #246 | Tragic 78.8% |
| Immigrants | Germany | 1.0 /100 | #247 | Tragic 78.8% |
| Immigrants | Caribbean | 1.0 /100 | #248 | Tragic 78.8% |
| English | 0.9 /100 | #249 | Tragic 78.8% |
| Hondurans | 0.8 /100 | #250 | Tragic 78.8% |
| Barbadians | 0.7 /100 | #251 | Tragic 78.8% |
| Immigrants | Honduras | 0.6 /100 | #252 | Tragic 78.7% |
| Basques | 0.5 /100 | #253 | Tragic 78.7% |
| Immigrants | Lebanon | 0.5 /100 | #254 | Tragic 78.7% |