Ethiopian vs Immigrants from Cambodia In Labor Force | Age 45-54
COMPARE
Ethiopian
Immigrants from Cambodia
In Labor Force | Age 45-54
In Labor Force | Age 45-54 Comparison
Ethiopians
Immigrants from Cambodia
84.8%
IN LABOR FORCE | AGE 45-54
100.0/ 100
METRIC RATING
5th/ 347
METRIC RANK
81.9%
IN LABOR FORCE | AGE 45-54
0.8/ 100
METRIC RATING
241st/ 347
METRIC RANK
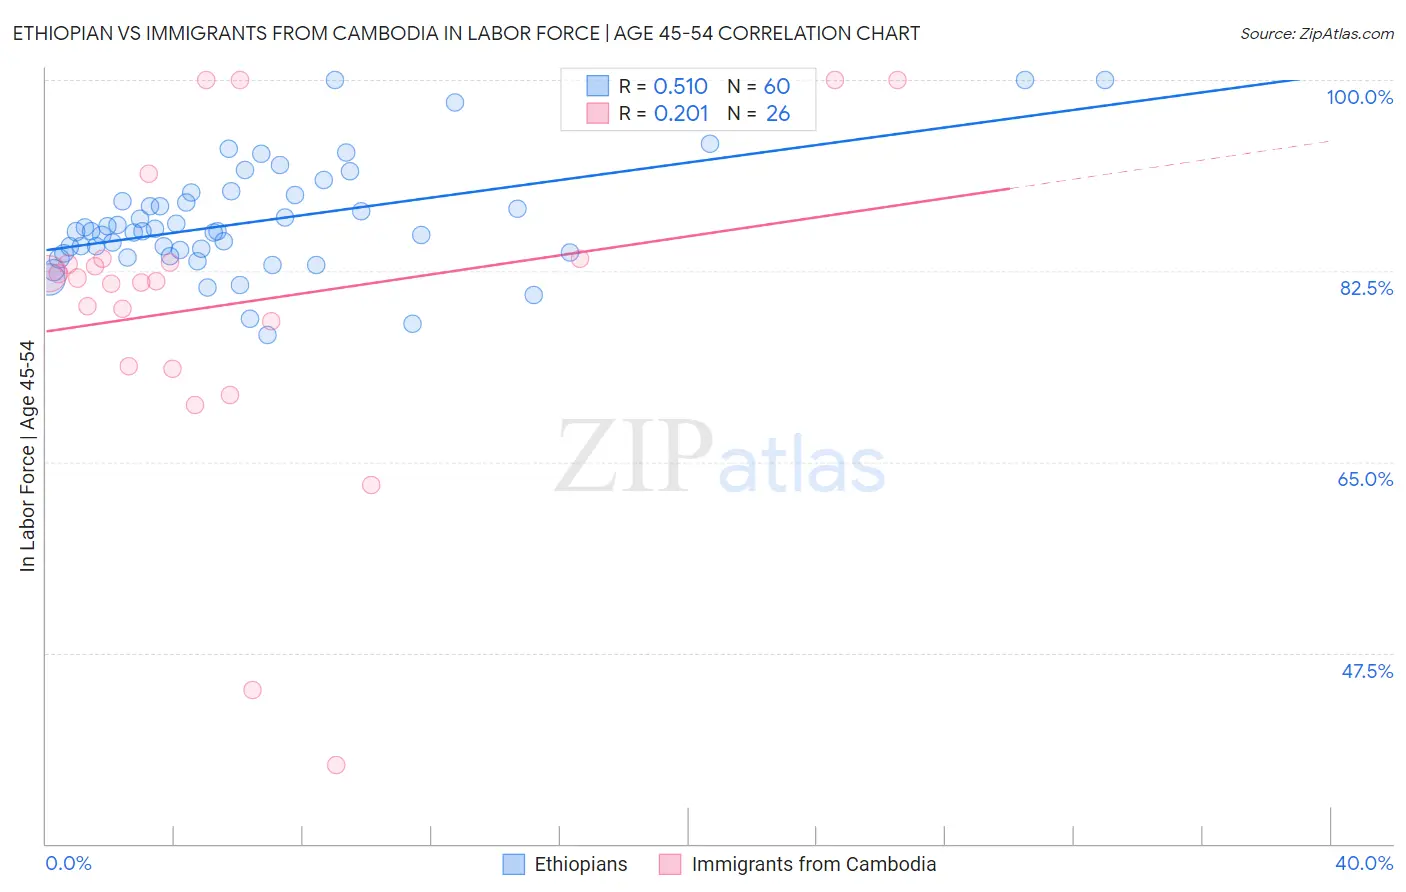
Ethiopian vs Immigrants from Cambodia In Labor Force | Age 45-54 Correlation Chart
The statistical analysis conducted on geographies consisting of 223,081,675 people shows a substantial positive correlation between the proportion of Ethiopians and labor force participation rate among population between the ages 45 and 54 in the United States with a correlation coefficient (R) of 0.510 and weighted average of 84.8%. Similarly, the statistical analysis conducted on geographies consisting of 205,128,905 people shows a weak positive correlation between the proportion of Immigrants from Cambodia and labor force participation rate among population between the ages 45 and 54 in the United States with a correlation coefficient (R) of 0.201 and weighted average of 81.9%, a difference of 3.5%.
In Labor Force | Age 45-54 Correlation Summary
| Measurement | Ethiopian | Immigrants from Cambodia |
| Minimum | 76.7% | 37.2% |
| Maximum | 100.0% | 100.0% |
| Range | 23.3% | 62.8% |
| Mean | 87.0% | 79.5% |
| Median | 86.1% | 81.7% |
| Interquartile 25% (IQ1) | 84.2% | 73.8% |
| Interquartile 75% (IQ3) | 89.2% | 83.6% |
| Interquartile Range (IQR) | 5.0% | 9.8% |
| Standard Deviation (Sample) | 5.0% | 14.8% |
| Standard Deviation (Population) | 5.0% | 14.5% |
Similar Demographics by In Labor Force | Age 45-54
Demographics Similar to Ethiopians by In Labor Force | Age 45-54
In terms of in labor force | age 45-54, the demographic groups most similar to Ethiopians are Immigrants from Ethiopia (84.8%, a difference of 0.080%), Immigrants from India (84.7%, a difference of 0.11%), Immigrants from Cameroon (84.6%, a difference of 0.18%), Bolivian (84.9%, a difference of 0.20%), and Luxembourger (85.0%, a difference of 0.29%).
| Demographics | Rating | Rank | In Labor Force | Age 45-54 |
| Immigrants | Bolivia | 100.0 /100 | #1 | Exceptional 85.3% |
| Luxembourgers | 100.0 /100 | #2 | Exceptional 85.0% |
| Bolivians | 100.0 /100 | #3 | Exceptional 84.9% |
| Immigrants | Ethiopia | 100.0 /100 | #4 | Exceptional 84.8% |
| Ethiopians | 100.0 /100 | #5 | Exceptional 84.8% |
| Immigrants | India | 100.0 /100 | #6 | Exceptional 84.7% |
| Immigrants | Cameroon | 100.0 /100 | #7 | Exceptional 84.6% |
| Sierra Leoneans | 100.0 /100 | #8 | Exceptional 84.5% |
| Immigrants | Sierra Leone | 100.0 /100 | #9 | Exceptional 84.4% |
| Norwegians | 100.0 /100 | #10 | Exceptional 84.4% |
| Thais | 100.0 /100 | #11 | Exceptional 84.3% |
| Bulgarians | 100.0 /100 | #12 | Exceptional 84.2% |
| Chinese | 99.9 /100 | #13 | Exceptional 84.1% |
| Cambodians | 99.9 /100 | #14 | Exceptional 84.1% |
| Cypriots | 99.9 /100 | #15 | Exceptional 84.1% |
Demographics Similar to Immigrants from Cambodia by In Labor Force | Age 45-54
In terms of in labor force | age 45-54, the demographic groups most similar to Immigrants from Cambodia are White/Caucasian (81.9%, a difference of 0.040%), Immigrants from El Salvador (81.9%, a difference of 0.050%), Samoan (81.8%, a difference of 0.050%), Immigrants from Thailand (81.9%, a difference of 0.060%), and Trinidadian and Tobagonian (81.9%, a difference of 0.080%).
| Demographics | Rating | Rank | In Labor Force | Age 45-54 |
| Salvadorans | 1.7 /100 | #234 | Tragic 82.0% |
| Sub-Saharan Africans | 1.2 /100 | #235 | Tragic 82.0% |
| Basques | 1.2 /100 | #236 | Tragic 82.0% |
| Immigrants | Trinidad and Tobago | 1.2 /100 | #237 | Tragic 82.0% |
| Trinidadians and Tobagonians | 1.1 /100 | #238 | Tragic 81.9% |
| Immigrants | Thailand | 1.0 /100 | #239 | Tragic 81.9% |
| Immigrants | El Salvador | 1.0 /100 | #240 | Tragic 81.9% |
| Immigrants | Cambodia | 0.8 /100 | #241 | Tragic 81.9% |
| Whites/Caucasians | 0.7 /100 | #242 | Tragic 81.9% |
| Samoans | 0.6 /100 | #243 | Tragic 81.8% |
| Celtics | 0.4 /100 | #244 | Tragic 81.8% |
| Alaska Natives | 0.4 /100 | #245 | Tragic 81.8% |
| Alaskan Athabascans | 0.4 /100 | #246 | Tragic 81.8% |
| Central Americans | 0.4 /100 | #247 | Tragic 81.7% |
| Puget Sound Salish | 0.3 /100 | #248 | Tragic 81.7% |