Immigrants from Uzbekistan vs Estonian In Labor Force | Age 45-54
COMPARE
Immigrants from Uzbekistan
Estonian
In Labor Force | Age 45-54
In Labor Force | Age 45-54 Comparison
Immigrants from Uzbekistan
Estonians
82.3%
IN LABOR FORCE | AGE 45-54
5.8/ 100
METRIC RATING
213th/ 347
METRIC RANK
83.4%
IN LABOR FORCE | AGE 45-54
96.9/ 100
METRIC RATING
75th/ 347
METRIC RANK
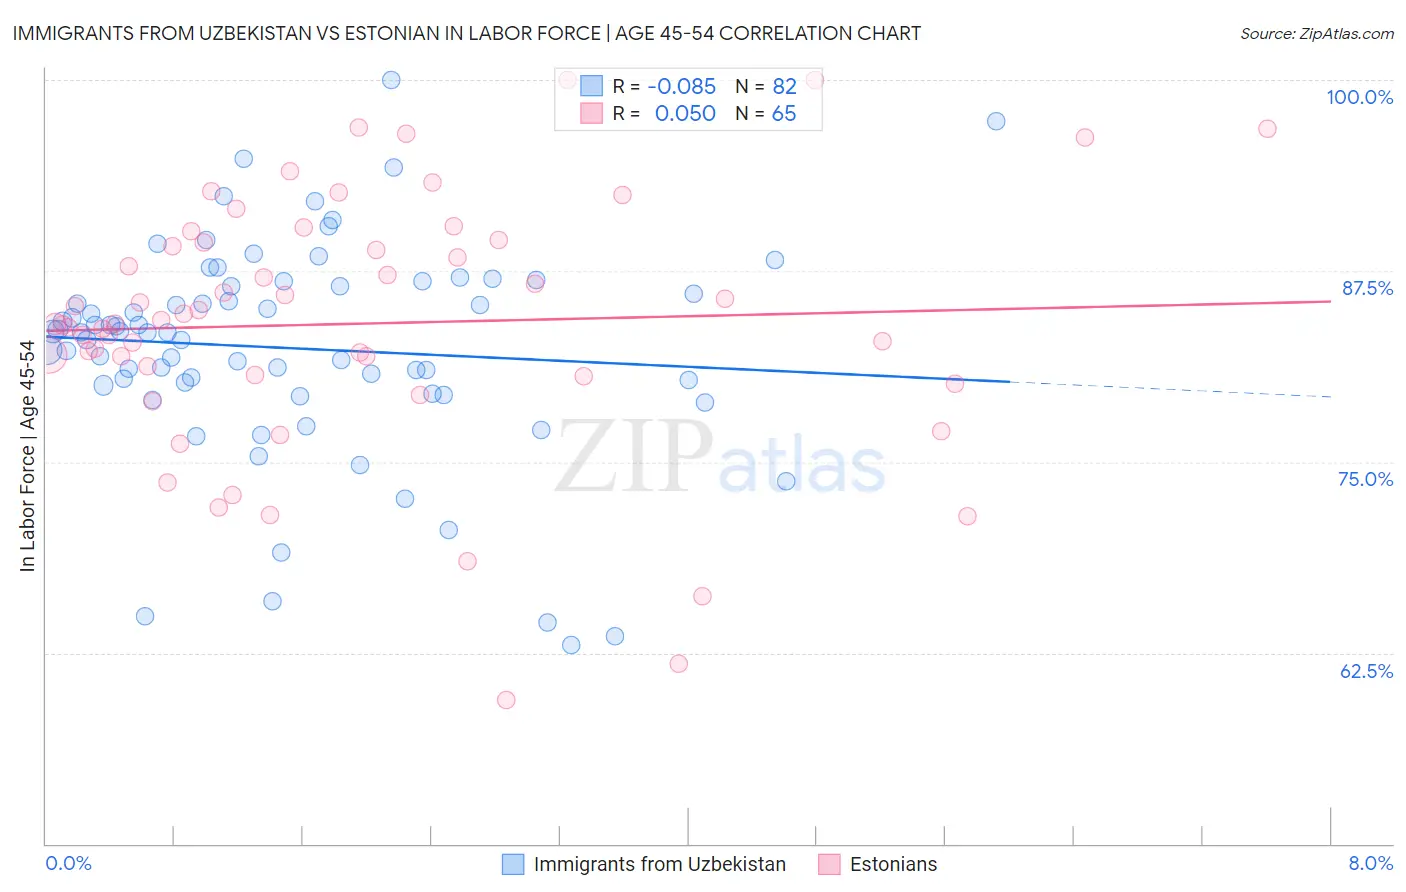
Immigrants from Uzbekistan vs Estonian In Labor Force | Age 45-54 Correlation Chart
The statistical analysis conducted on geographies consisting of 118,730,775 people shows a slight negative correlation between the proportion of Immigrants from Uzbekistan and labor force participation rate among population between the ages 45 and 54 in the United States with a correlation coefficient (R) of -0.085 and weighted average of 82.3%. Similarly, the statistical analysis conducted on geographies consisting of 123,497,909 people shows no correlation between the proportion of Estonians and labor force participation rate among population between the ages 45 and 54 in the United States with a correlation coefficient (R) of 0.050 and weighted average of 83.4%, a difference of 1.4%.
In Labor Force | Age 45-54 Correlation Summary
| Measurement | Immigrants from Uzbekistan | Estonian |
| Minimum | 63.0% | 59.4% |
| Maximum | 100.0% | 100.0% |
| Range | 37.0% | 40.6% |
| Mean | 82.4% | 84.0% |
| Median | 83.5% | 84.0% |
| Interquartile 25% (IQ1) | 80.0% | 80.7% |
| Interquartile 75% (IQ3) | 86.5% | 89.4% |
| Interquartile Range (IQR) | 6.5% | 8.8% |
| Standard Deviation (Sample) | 7.1% | 8.4% |
| Standard Deviation (Population) | 7.1% | 8.4% |
Similar Demographics by In Labor Force | Age 45-54
Demographics Similar to Immigrants from Uzbekistan by In Labor Force | Age 45-54
In terms of in labor force | age 45-54, the demographic groups most similar to Immigrants from Uzbekistan are Immigrants from Panama (82.2%, a difference of 0.010%), Iraqi (82.2%, a difference of 0.010%), Ecuadorian (82.3%, a difference of 0.020%), Scottish (82.2%, a difference of 0.020%), and Immigrants from Syria (82.3%, a difference of 0.030%).
| Demographics | Rating | Rank | In Labor Force | Age 45-54 |
| Welsh | 9.2 /100 | #206 | Tragic 82.3% |
| Immigrants | Cabo Verde | 8.6 /100 | #207 | Tragic 82.3% |
| Native Hawaiians | 8.5 /100 | #208 | Tragic 82.3% |
| Immigrants | Lebanon | 7.4 /100 | #209 | Tragic 82.3% |
| Immigrants | Bahamas | 7.1 /100 | #210 | Tragic 82.3% |
| Immigrants | Syria | 6.6 /100 | #211 | Tragic 82.3% |
| Ecuadorians | 6.3 /100 | #212 | Tragic 82.3% |
| Immigrants | Uzbekistan | 5.8 /100 | #213 | Tragic 82.3% |
| Immigrants | Panama | 5.6 /100 | #214 | Tragic 82.2% |
| Iraqis | 5.6 /100 | #215 | Tragic 82.2% |
| Scottish | 5.3 /100 | #216 | Tragic 82.2% |
| Portuguese | 4.7 /100 | #217 | Tragic 82.2% |
| English | 4.4 /100 | #218 | Tragic 82.2% |
| French | 4.1 /100 | #219 | Tragic 82.2% |
| Bahamians | 3.6 /100 | #220 | Tragic 82.2% |
Demographics Similar to Estonians by In Labor Force | Age 45-54
In terms of in labor force | age 45-54, the demographic groups most similar to Estonians are Immigrants from Somalia (83.4%, a difference of 0.0%), Russian (83.4%, a difference of 0.0%), Immigrants from Czechoslovakia (83.4%, a difference of 0.010%), Cuban (83.4%, a difference of 0.010%), and Serbian (83.4%, a difference of 0.020%).
| Demographics | Rating | Rank | In Labor Force | Age 45-54 |
| Immigrants | Colombia | 97.6 /100 | #68 | Exceptional 83.4% |
| Taiwanese | 97.5 /100 | #69 | Exceptional 83.4% |
| Immigrants | Latvia | 97.4 /100 | #70 | Exceptional 83.4% |
| Colombians | 97.3 /100 | #71 | Exceptional 83.4% |
| Serbians | 97.2 /100 | #72 | Exceptional 83.4% |
| Immigrants | Czechoslovakia | 97.1 /100 | #73 | Exceptional 83.4% |
| Immigrants | Somalia | 96.9 /100 | #74 | Exceptional 83.4% |
| Estonians | 96.9 /100 | #75 | Exceptional 83.4% |
| Russians | 96.8 /100 | #76 | Exceptional 83.4% |
| Cubans | 96.7 /100 | #77 | Exceptional 83.4% |
| Immigrants | Egypt | 96.6 /100 | #78 | Exceptional 83.4% |
| Belgians | 96.5 /100 | #79 | Exceptional 83.4% |
| Immigrants | Croatia | 96.5 /100 | #80 | Exceptional 83.4% |
| Jordanians | 96.4 /100 | #81 | Exceptional 83.4% |
| Immigrants | Eastern Asia | 96.3 /100 | #82 | Exceptional 83.4% |