Ecuadorian vs German Russian In Labor Force | Age > 16
COMPARE
Ecuadorian
German Russian
In Labor Force | Age > 16
In Labor Force | Age > 16 Comparison
Ecuadorians
German Russians
65.6%
IN LABOR FORCE | AGE > 16
94.7/ 100
METRIC RATING
128th/ 347
METRIC RANK
66.1%
IN LABOR FORCE | AGE > 16
99.4/ 100
METRIC RATING
82nd/ 347
METRIC RANK
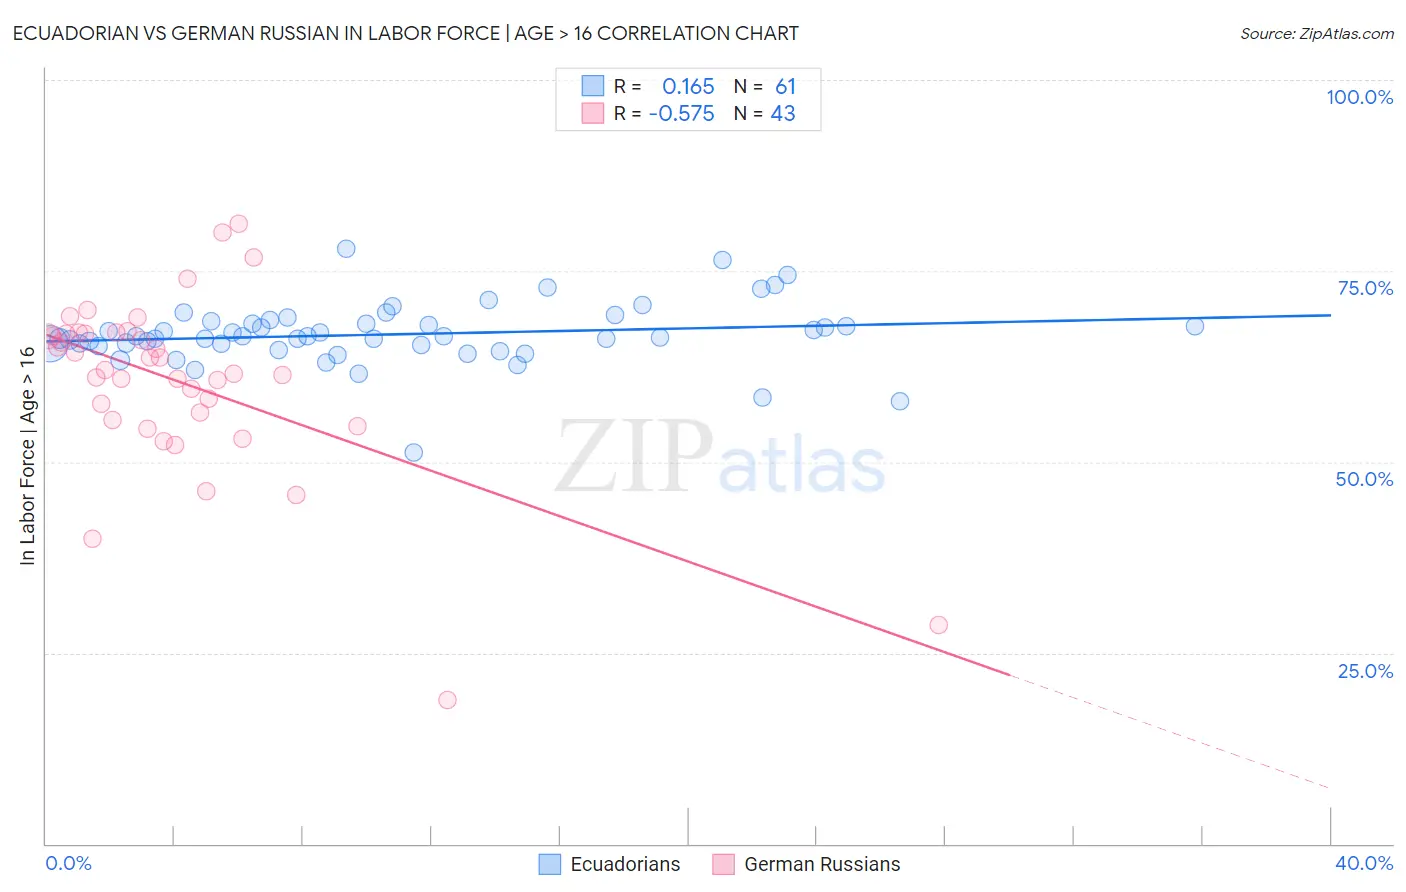
Ecuadorian vs German Russian In Labor Force | Age > 16 Correlation Chart
The statistical analysis conducted on geographies consisting of 317,862,233 people shows a poor positive correlation between the proportion of Ecuadorians and labor force participation rate among population ages 16 and over in the United States with a correlation coefficient (R) of 0.165 and weighted average of 65.6%. Similarly, the statistical analysis conducted on geographies consisting of 96,458,979 people shows a substantial negative correlation between the proportion of German Russians and labor force participation rate among population ages 16 and over in the United States with a correlation coefficient (R) of -0.575 and weighted average of 66.1%, a difference of 0.64%.
In Labor Force | Age > 16 Correlation Summary
| Measurement | Ecuadorian | German Russian |
| Minimum | 51.2% | 18.8% |
| Maximum | 77.9% | 81.2% |
| Range | 26.7% | 62.4% |
| Mean | 66.7% | 60.5% |
| Median | 66.4% | 62.0% |
| Interquartile 25% (IQ1) | 65.3% | 55.5% |
| Interquartile 75% (IQ3) | 68.2% | 66.8% |
| Interquartile Range (IQR) | 3.0% | 11.4% |
| Standard Deviation (Sample) | 4.1% | 11.8% |
| Standard Deviation (Population) | 4.1% | 11.6% |
Similar Demographics by In Labor Force | Age > 16
Demographics Similar to Ecuadorians by In Labor Force | Age > 16
In terms of in labor force | age > 16, the demographic groups most similar to Ecuadorians are Immigrants from Eastern Asia (65.7%, a difference of 0.010%), Immigrants from Philippines (65.6%, a difference of 0.010%), Immigrants from Guatemala (65.6%, a difference of 0.020%), Icelander (65.6%, a difference of 0.020%), and Norwegian (65.7%, a difference of 0.030%).
| Demographics | Rating | Rank | In Labor Force | Age > 16 |
| New Zealanders | 96.0 /100 | #121 | Exceptional 65.7% |
| Immigrants | Ecuador | 95.9 /100 | #122 | Exceptional 65.7% |
| Immigrants | Iraq | 95.5 /100 | #123 | Exceptional 65.7% |
| Iraqis | 95.4 /100 | #124 | Exceptional 65.7% |
| Norwegians | 95.3 /100 | #125 | Exceptional 65.7% |
| Koreans | 95.3 /100 | #126 | Exceptional 65.7% |
| Immigrants | Eastern Asia | 94.9 /100 | #127 | Exceptional 65.7% |
| Ecuadorians | 94.7 /100 | #128 | Exceptional 65.6% |
| Immigrants | Philippines | 94.5 /100 | #129 | Exceptional 65.6% |
| Immigrants | Guatemala | 94.4 /100 | #130 | Exceptional 65.6% |
| Icelanders | 94.3 /100 | #131 | Exceptional 65.6% |
| Immigrants | North Macedonia | 94.1 /100 | #132 | Exceptional 65.6% |
| Immigrants | Lithuania | 93.5 /100 | #133 | Exceptional 65.6% |
| Costa Ricans | 93.2 /100 | #134 | Exceptional 65.6% |
| Guatemalans | 92.5 /100 | #135 | Exceptional 65.6% |
Demographics Similar to German Russians by In Labor Force | Age > 16
In terms of in labor force | age > 16, the demographic groups most similar to German Russians are Immigrants from Jordan (66.1%, a difference of 0.0%), Moroccan (66.1%, a difference of 0.010%), Central American (66.1%, a difference of 0.010%), Mongolian (66.1%, a difference of 0.020%), and South American (66.0%, a difference of 0.040%).
| Demographics | Rating | Rank | In Labor Force | Age > 16 |
| Immigrants | Singapore | 99.7 /100 | #75 | Exceptional 66.2% |
| Immigrants | Malaysia | 99.6 /100 | #76 | Exceptional 66.1% |
| Immigrants | Moldova | 99.6 /100 | #77 | Exceptional 66.1% |
| Immigrants | Asia | 99.6 /100 | #78 | Exceptional 66.1% |
| Turks | 99.6 /100 | #79 | Exceptional 66.1% |
| Malaysians | 99.6 /100 | #80 | Exceptional 66.1% |
| Moroccans | 99.5 /100 | #81 | Exceptional 66.1% |
| German Russians | 99.4 /100 | #82 | Exceptional 66.1% |
| Immigrants | Jordan | 99.4 /100 | #83 | Exceptional 66.1% |
| Central Americans | 99.4 /100 | #84 | Exceptional 66.1% |
| Mongolians | 99.4 /100 | #85 | Exceptional 66.1% |
| South Americans | 99.4 /100 | #86 | Exceptional 66.0% |
| South American Indians | 99.4 /100 | #87 | Exceptional 66.0% |
| Bermudans | 99.3 /100 | #88 | Exceptional 66.0% |
| Immigrants | Laos | 99.2 /100 | #89 | Exceptional 66.0% |