Immigrants from Germany vs French In Labor Force | Age 30-34
COMPARE
Immigrants from Germany
French
In Labor Force | Age 30-34
In Labor Force | Age 30-34 Comparison
Immigrants from Germany
French
84.3%
IN LABOR FORCE | AGE 30-34
7.2/ 100
METRIC RATING
214th/ 347
METRIC RANK
84.4%
IN LABOR FORCE | AGE 30-34
13.8/ 100
METRIC RATING
205th/ 347
METRIC RANK
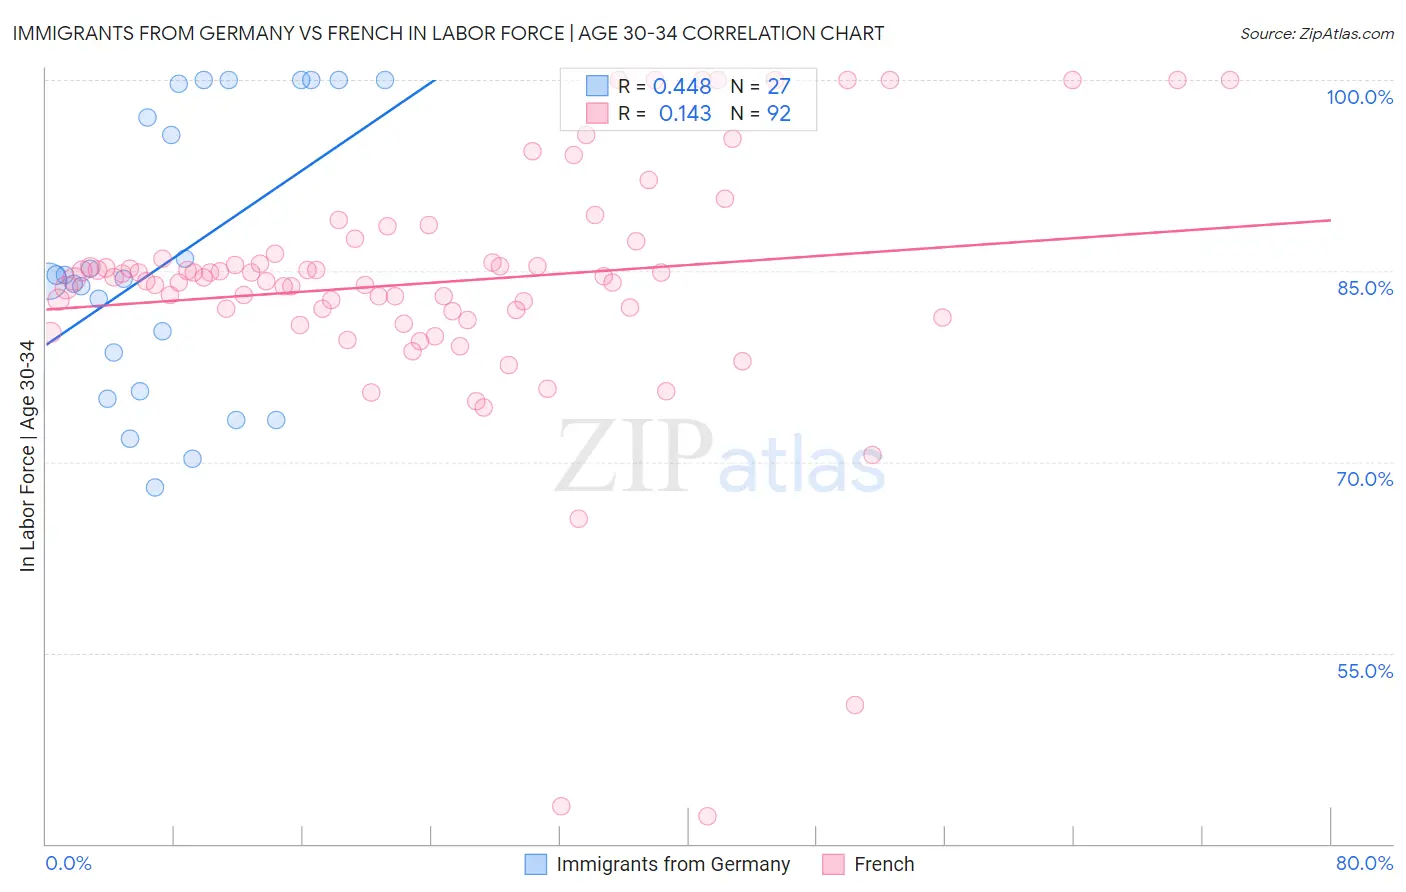
Immigrants from Germany vs French In Labor Force | Age 30-34 Correlation Chart
The statistical analysis conducted on geographies consisting of 463,598,639 people shows a moderate positive correlation between the proportion of Immigrants from Germany and labor force participation rate among population between the ages 30 and 34 in the United States with a correlation coefficient (R) of 0.448 and weighted average of 84.3%. Similarly, the statistical analysis conducted on geographies consisting of 571,091,805 people shows a poor positive correlation between the proportion of French and labor force participation rate among population between the ages 30 and 34 in the United States with a correlation coefficient (R) of 0.143 and weighted average of 84.4%, a difference of 0.13%.
In Labor Force | Age 30-34 Correlation Summary
| Measurement | Immigrants from Germany | French |
| Minimum | 67.9% | 42.2% |
| Maximum | 100.0% | 100.0% |
| Range | 32.1% | 57.8% |
| Mean | 85.9% | 84.1% |
| Median | 84.4% | 84.5% |
| Interquartile 25% (IQ1) | 75.5% | 81.9% |
| Interquartile 75% (IQ3) | 99.7% | 86.2% |
| Interquartile Range (IQR) | 24.2% | 4.3% |
| Standard Deviation (Sample) | 10.8% | 10.0% |
| Standard Deviation (Population) | 10.6% | 9.9% |
Demographics Similar to Immigrants from Germany and French by In Labor Force | Age 30-34
In terms of in labor force | age 30-34, the demographic groups most similar to Immigrants from Germany are European (84.3%, a difference of 0.0%), Immigrants from Ecuador (84.3%, a difference of 0.0%), Immigrants from Trinidad and Tobago (84.3%, a difference of 0.010%), Immigrants from Western Asia (84.3%, a difference of 0.020%), and Immigrants from Jamaica (84.3%, a difference of 0.020%). Similarly, the demographic groups most similar to French are Ecuadorian (84.4%, a difference of 0.010%), Canadian (84.4%, a difference of 0.020%), Lebanese (84.4%, a difference of 0.050%), Trinidadian and Tobagonian (84.5%, a difference of 0.060%), and Immigrants from West Indies (84.5%, a difference of 0.060%).
| Demographics | Rating | Rank | In Labor Force | Age 30-34 |
| Immigrants | Thailand | 19.1 /100 | #199 | Poor 84.5% |
| Sub-Saharan Africans | 19.0 /100 | #200 | Poor 84.5% |
| Trinidadians and Tobagonians | 18.2 /100 | #201 | Poor 84.5% |
| Immigrants | West Indies | 18.1 /100 | #202 | Poor 84.5% |
| Canadians | 15.4 /100 | #203 | Poor 84.4% |
| Ecuadorians | 14.2 /100 | #204 | Poor 84.4% |
| French | 13.8 /100 | #205 | Poor 84.4% |
| Lebanese | 10.6 /100 | #206 | Poor 84.4% |
| Bangladeshis | 9.4 /100 | #207 | Tragic 84.3% |
| Arabs | 8.9 /100 | #208 | Tragic 84.3% |
| Jamaicans | 8.8 /100 | #209 | Tragic 84.3% |
| Indonesians | 8.8 /100 | #210 | Tragic 84.3% |
| Japanese | 8.8 /100 | #211 | Tragic 84.3% |
| Immigrants | Western Asia | 8.2 /100 | #212 | Tragic 84.3% |
| Immigrants | Jamaica | 7.9 /100 | #213 | Tragic 84.3% |
| Immigrants | Germany | 7.2 /100 | #214 | Tragic 84.3% |
| Europeans | 7.2 /100 | #215 | Tragic 84.3% |
| Immigrants | Ecuador | 7.1 /100 | #216 | Tragic 84.3% |
| Immigrants | Trinidad and Tobago | 7.0 /100 | #217 | Tragic 84.3% |
| Immigrants | Panama | 6.3 /100 | #218 | Tragic 84.3% |
| Swiss | 5.8 /100 | #219 | Tragic 84.3% |