Cajun vs Iranian In Labor Force | Age 20-64
COMPARE
Cajun
Iranian
In Labor Force | Age 20-64
In Labor Force | Age 20-64 Comparison
Cajuns
Iranians
75.5%
IN LABOR FORCE | AGE 20-64
0.0/ 100
METRIC RATING
323rd/ 347
METRIC RANK
80.0%
IN LABOR FORCE | AGE 20-64
94.3/ 100
METRIC RATING
108th/ 347
METRIC RANK
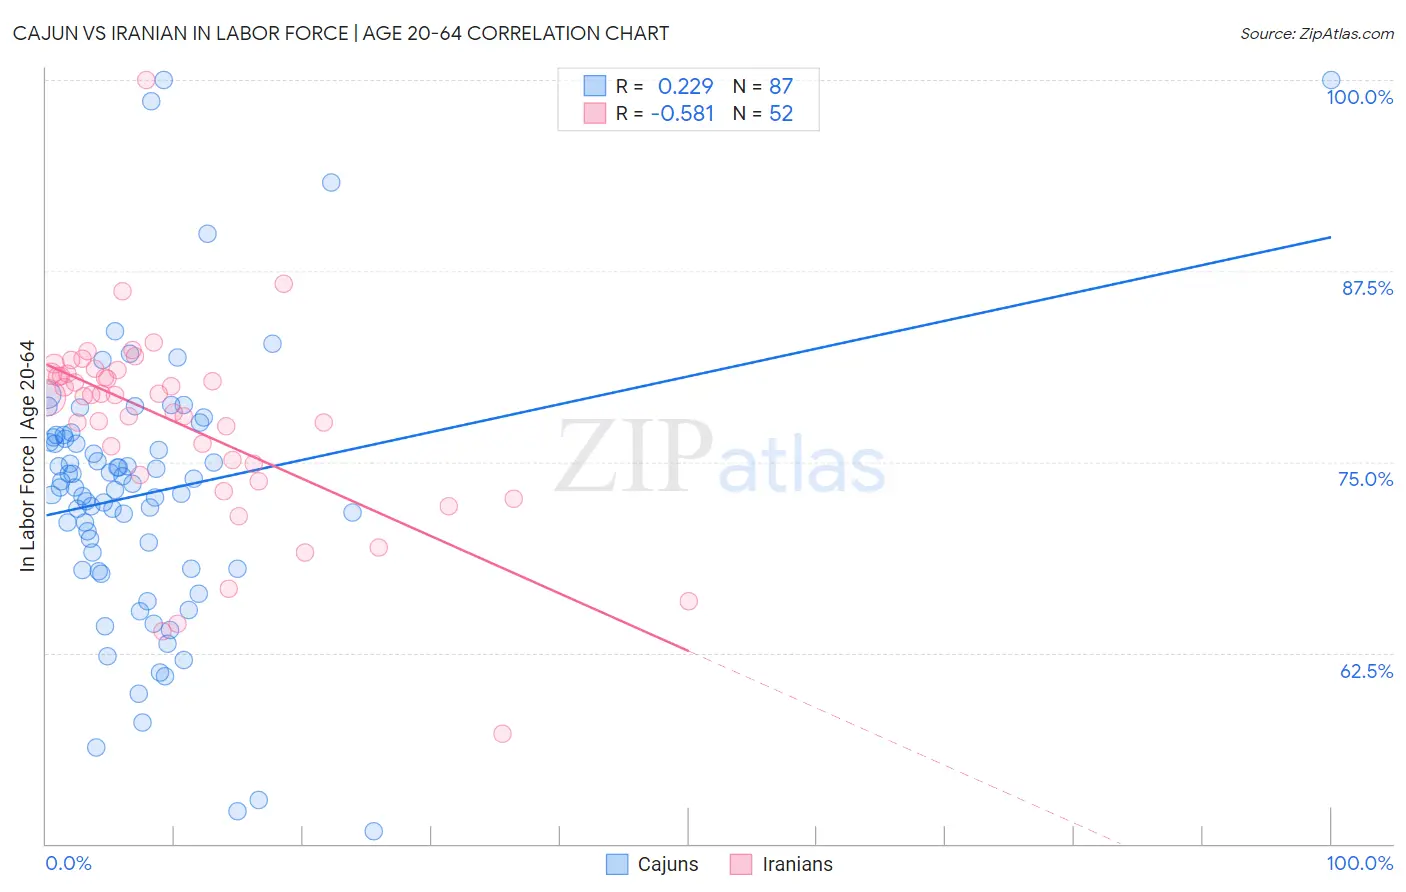
Cajun vs Iranian In Labor Force | Age 20-64 Correlation Chart
The statistical analysis conducted on geographies consisting of 149,713,173 people shows a weak positive correlation between the proportion of Cajuns and labor force participation rate among population between the ages 20 and 64 in the United States with a correlation coefficient (R) of 0.229 and weighted average of 75.5%. Similarly, the statistical analysis conducted on geographies consisting of 316,908,203 people shows a substantial negative correlation between the proportion of Iranians and labor force participation rate among population between the ages 20 and 64 in the United States with a correlation coefficient (R) of -0.581 and weighted average of 80.0%, a difference of 6.0%.
In Labor Force | Age 20-64 Correlation Summary
| Measurement | Cajun | Iranian |
| Minimum | 50.8% | 57.2% |
| Maximum | 100.0% | 100.0% |
| Range | 49.2% | 42.8% |
| Mean | 72.9% | 77.5% |
| Median | 73.4% | 79.3% |
| Interquartile 25% (IQ1) | 68.0% | 74.5% |
| Interquartile 75% (IQ3) | 76.6% | 80.8% |
| Interquartile Range (IQR) | 8.6% | 6.3% |
| Standard Deviation (Sample) | 9.0% | 6.6% |
| Standard Deviation (Population) | 8.9% | 6.6% |
Similar Demographics by In Labor Force | Age 20-64
Demographics Similar to Cajuns by In Labor Force | Age 20-64
In terms of in labor force | age 20-64, the demographic groups most similar to Cajuns are Dutch West Indian (75.5%, a difference of 0.040%), Choctaw (75.4%, a difference of 0.060%), Seminole (75.5%, a difference of 0.090%), Menominee (75.3%, a difference of 0.19%), and Creek (75.1%, a difference of 0.42%).
| Demographics | Rating | Rank | In Labor Force | Age 20-64 |
| Yaqui | 0.0 /100 | #316 | Tragic 76.5% |
| Cherokee | 0.0 /100 | #317 | Tragic 76.2% |
| Chickasaw | 0.0 /100 | #318 | Tragic 76.2% |
| Inupiat | 0.0 /100 | #319 | Tragic 76.1% |
| Yakama | 0.0 /100 | #320 | Tragic 75.8% |
| Seminole | 0.0 /100 | #321 | Tragic 75.5% |
| Dutch West Indians | 0.0 /100 | #322 | Tragic 75.5% |
| Cajuns | 0.0 /100 | #323 | Tragic 75.5% |
| Choctaw | 0.0 /100 | #324 | Tragic 75.4% |
| Menominee | 0.0 /100 | #325 | Tragic 75.3% |
| Creek | 0.0 /100 | #326 | Tragic 75.1% |
| Sioux | 0.0 /100 | #327 | Tragic 75.0% |
| Kiowa | 0.0 /100 | #328 | Tragic 75.0% |
| Cheyenne | 0.0 /100 | #329 | Tragic 74.8% |
| Colville | 0.0 /100 | #330 | Tragic 74.8% |
Demographics Similar to Iranians by In Labor Force | Age 20-64
In terms of in labor force | age 20-64, the demographic groups most similar to Iranians are Immigrants from Argentina (80.0%, a difference of 0.010%), Estonian (80.0%, a difference of 0.010%), Immigrants from South America (80.0%, a difference of 0.010%), Immigrants from Italy (80.0%, a difference of 0.010%), and Greek (80.0%, a difference of 0.020%).
| Demographics | Rating | Rank | In Labor Force | Age 20-64 |
| Palestinians | 95.5 /100 | #101 | Exceptional 80.0% |
| Immigrants | Australia | 95.5 /100 | #102 | Exceptional 80.0% |
| Russians | 95.5 /100 | #103 | Exceptional 80.0% |
| Venezuelans | 95.3 /100 | #104 | Exceptional 80.0% |
| Immigrants | Ghana | 95.0 /100 | #105 | Exceptional 80.0% |
| Greeks | 94.8 /100 | #106 | Exceptional 80.0% |
| Immigrants | Jordan | 94.8 /100 | #107 | Exceptional 80.0% |
| Iranians | 94.3 /100 | #108 | Exceptional 80.0% |
| Immigrants | Argentina | 94.1 /100 | #109 | Exceptional 80.0% |
| Estonians | 94.0 /100 | #110 | Exceptional 80.0% |
| Immigrants | South America | 93.9 /100 | #111 | Exceptional 80.0% |
| Immigrants | Italy | 93.9 /100 | #112 | Exceptional 80.0% |
| Sri Lankans | 93.9 /100 | #113 | Exceptional 80.0% |
| Argentineans | 93.8 /100 | #114 | Exceptional 80.0% |
| Bermudans | 93.3 /100 | #115 | Exceptional 80.0% |