Cuban vs Immigrants from Guyana In Labor Force | Age 30-34
COMPARE
Cuban
Immigrants from Guyana
In Labor Force | Age 30-34
In Labor Force | Age 30-34 Comparison
Cubans
Immigrants from Guyana
84.2%
IN LABOR FORCE | AGE 30-34
3.4/ 100
METRIC RATING
224th/ 347
METRIC RANK
83.8%
IN LABOR FORCE | AGE 30-34
0.2/ 100
METRIC RATING
263rd/ 347
METRIC RANK
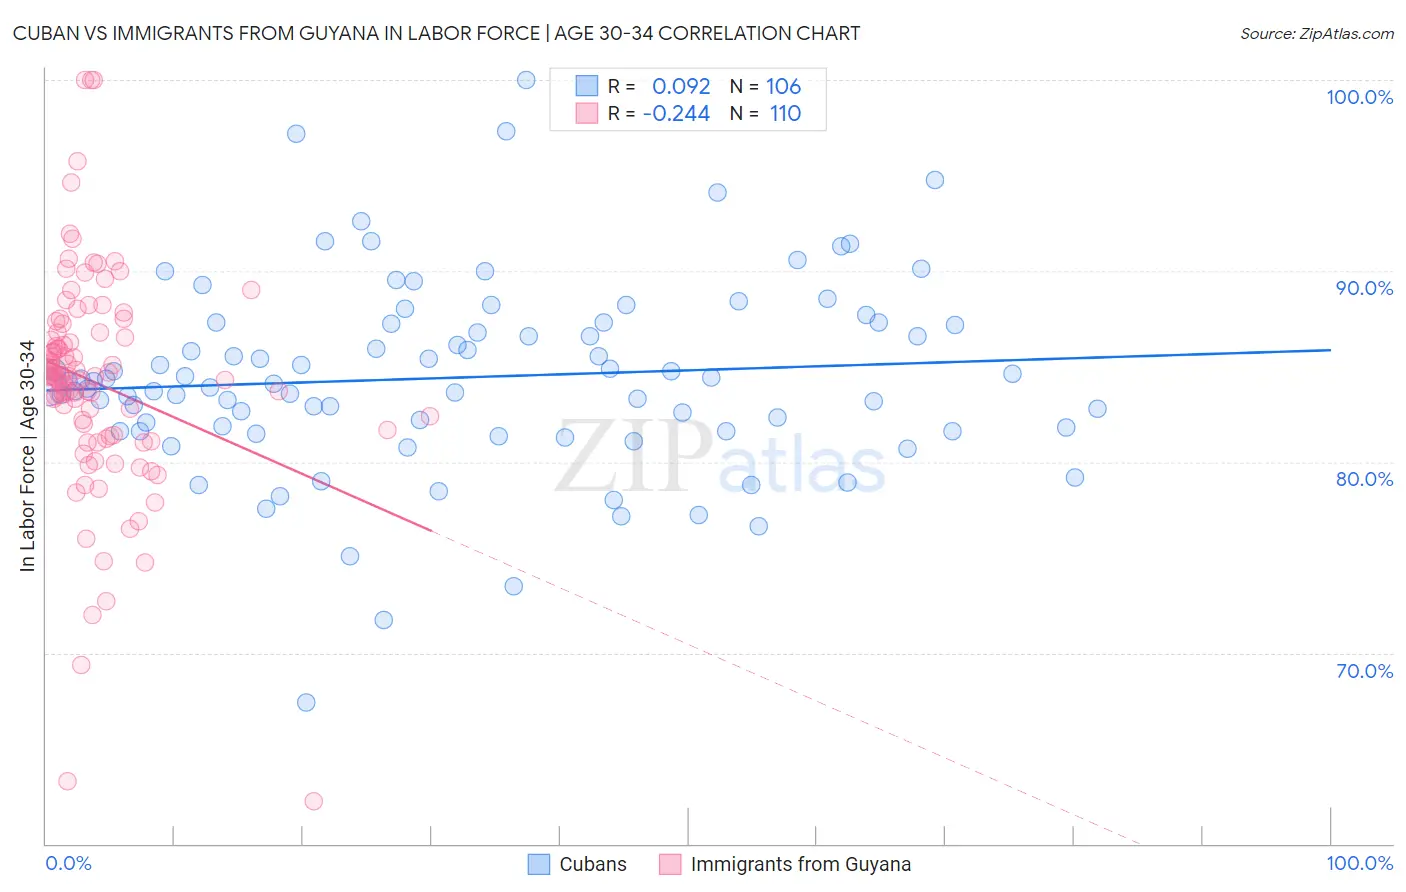
Cuban vs Immigrants from Guyana In Labor Force | Age 30-34 Correlation Chart
The statistical analysis conducted on geographies consisting of 448,964,387 people shows a slight positive correlation between the proportion of Cubans and labor force participation rate among population between the ages 30 and 34 in the United States with a correlation coefficient (R) of 0.092 and weighted average of 84.2%. Similarly, the statistical analysis conducted on geographies consisting of 183,640,015 people shows a weak negative correlation between the proportion of Immigrants from Guyana and labor force participation rate among population between the ages 30 and 34 in the United States with a correlation coefficient (R) of -0.244 and weighted average of 83.8%, a difference of 0.49%.
In Labor Force | Age 30-34 Correlation Summary
| Measurement | Cuban | Immigrants from Guyana |
| Minimum | 67.4% | 62.2% |
| Maximum | 100.0% | 100.0% |
| Range | 32.6% | 37.8% |
| Mean | 84.4% | 84.1% |
| Median | 84.1% | 84.5% |
| Interquartile 25% (IQ1) | 81.6% | 81.4% |
| Interquartile 75% (IQ3) | 87.3% | 86.8% |
| Interquartile Range (IQR) | 5.6% | 5.4% |
| Standard Deviation (Sample) | 5.1% | 5.9% |
| Standard Deviation (Population) | 5.1% | 5.8% |
Similar Demographics by In Labor Force | Age 30-34
Demographics Similar to Cubans by In Labor Force | Age 30-34
In terms of in labor force | age 30-34, the demographic groups most similar to Cubans are Immigrants from Laos (84.2%, a difference of 0.010%), Salvadoran (84.2%, a difference of 0.020%), Panamanian (84.2%, a difference of 0.020%), Scottish (84.2%, a difference of 0.020%), and Immigrants from El Salvador (84.2%, a difference of 0.020%).
| Demographics | Rating | Rank | In Labor Force | Age 30-34 |
| Immigrants | Trinidad and Tobago | 7.0 /100 | #217 | Tragic 84.3% |
| Immigrants | Panama | 6.3 /100 | #218 | Tragic 84.3% |
| Swiss | 5.8 /100 | #219 | Tragic 84.3% |
| Danes | 5.3 /100 | #220 | Tragic 84.3% |
| Salvadorans | 3.8 /100 | #221 | Tragic 84.2% |
| Panamanians | 3.8 /100 | #222 | Tragic 84.2% |
| Immigrants | Laos | 3.6 /100 | #223 | Tragic 84.2% |
| Cubans | 3.4 /100 | #224 | Tragic 84.2% |
| Scottish | 3.1 /100 | #225 | Tragic 84.2% |
| Immigrants | El Salvador | 3.0 /100 | #226 | Tragic 84.2% |
| Immigrants | Cuba | 3.0 /100 | #227 | Tragic 84.2% |
| Immigrants | Haiti | 2.8 /100 | #228 | Tragic 84.2% |
| Welsh | 2.7 /100 | #229 | Tragic 84.2% |
| Immigrants | Bahamas | 2.6 /100 | #230 | Tragic 84.1% |
| Malaysians | 2.2 /100 | #231 | Tragic 84.1% |
Demographics Similar to Immigrants from Guyana by In Labor Force | Age 30-34
In terms of in labor force | age 30-34, the demographic groups most similar to Immigrants from Guyana are Dominican (83.8%, a difference of 0.0%), Guyanese (83.8%, a difference of 0.020%), Immigrants from Dominican Republic (83.8%, a difference of 0.030%), Honduran (83.8%, a difference of 0.050%), and Scotch-Irish (83.8%, a difference of 0.050%).
| Demographics | Rating | Rank | In Labor Force | Age 30-34 |
| Immigrants | Lebanon | 0.4 /100 | #256 | Tragic 83.9% |
| Iraqis | 0.3 /100 | #257 | Tragic 83.8% |
| Hondurans | 0.3 /100 | #258 | Tragic 83.8% |
| Scotch-Irish | 0.3 /100 | #259 | Tragic 83.8% |
| Immigrants | Dominican Republic | 0.3 /100 | #260 | Tragic 83.8% |
| Guyanese | 0.3 /100 | #261 | Tragic 83.8% |
| Dominicans | 0.2 /100 | #262 | Tragic 83.8% |
| Immigrants | Guyana | 0.2 /100 | #263 | Tragic 83.8% |
| Guatemalans | 0.2 /100 | #264 | Tragic 83.7% |
| Immigrants | Honduras | 0.1 /100 | #265 | Tragic 83.7% |
| Immigrants | Guatemala | 0.1 /100 | #266 | Tragic 83.7% |
| Spaniards | 0.1 /100 | #267 | Tragic 83.6% |
| Immigrants | Bangladesh | 0.1 /100 | #268 | Tragic 83.6% |
| Vietnamese | 0.1 /100 | #269 | Tragic 83.6% |
| Spanish Americans | 0.0 /100 | #270 | Tragic 83.5% |