Immigrants from Guyana vs Immigrants from Portugal In Labor Force | Age 30-34
COMPARE
Immigrants from Guyana
Immigrants from Portugal
In Labor Force | Age 30-34
In Labor Force | Age 30-34 Comparison
Immigrants from Guyana
Immigrants from Portugal
83.8%
IN LABOR FORCE | AGE 30-34
0.2/ 100
METRIC RATING
263rd/ 347
METRIC RANK
84.0%
IN LABOR FORCE | AGE 30-34
1.2/ 100
METRIC RATING
241st/ 347
METRIC RANK
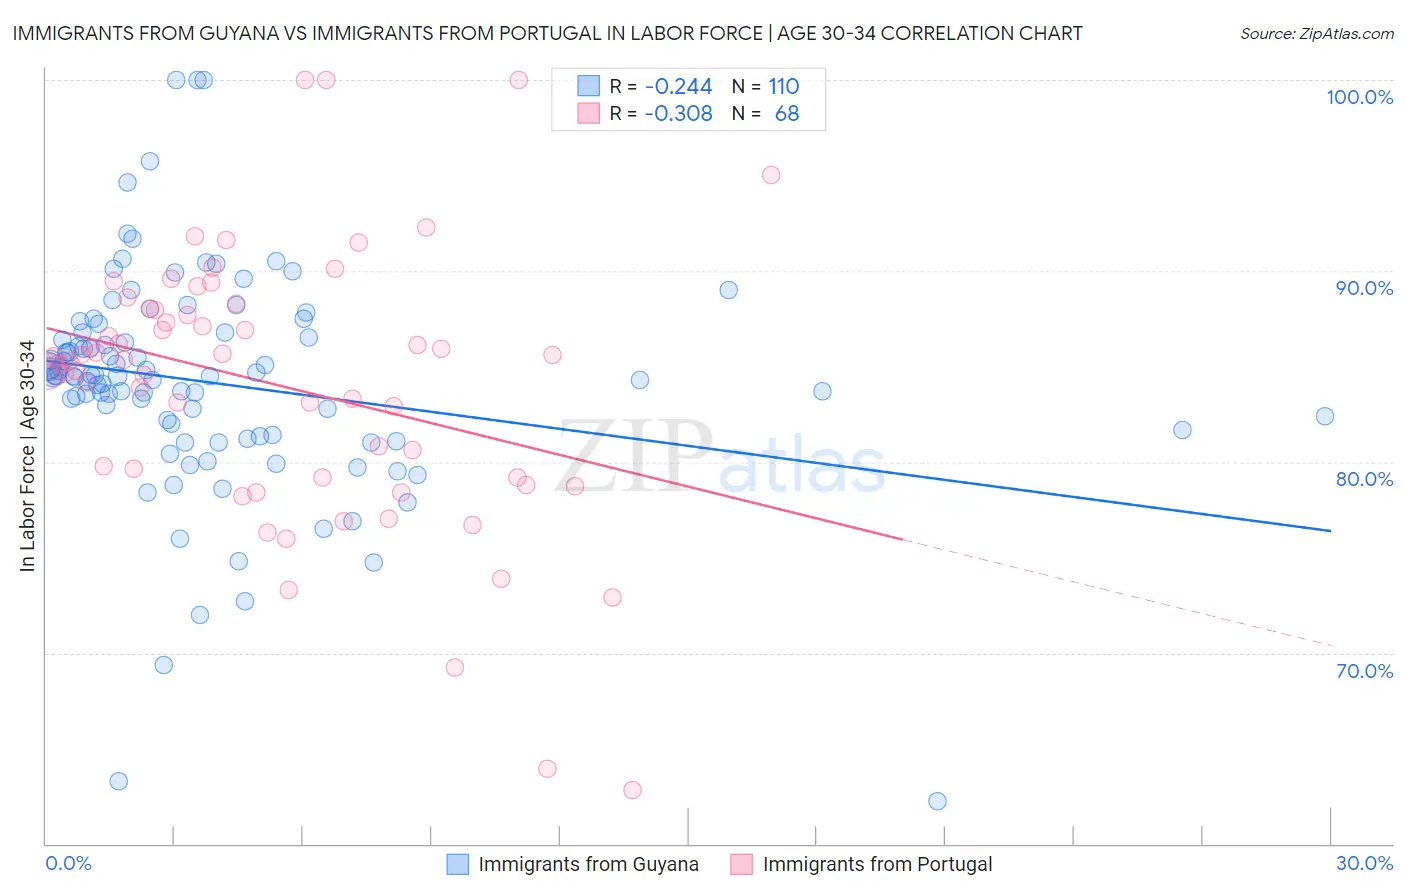
Immigrants from Guyana vs Immigrants from Portugal In Labor Force | Age 30-34 Correlation Chart
The statistical analysis conducted on geographies consisting of 183,640,015 people shows a weak negative correlation between the proportion of Immigrants from Guyana and labor force participation rate among population between the ages 30 and 34 in the United States with a correlation coefficient (R) of -0.244 and weighted average of 83.8%. Similarly, the statistical analysis conducted on geographies consisting of 174,756,515 people shows a mild negative correlation between the proportion of Immigrants from Portugal and labor force participation rate among population between the ages 30 and 34 in the United States with a correlation coefficient (R) of -0.308 and weighted average of 84.0%, a difference of 0.30%.
In Labor Force | Age 30-34 Correlation Summary
| Measurement | Immigrants from Guyana | Immigrants from Portugal |
| Minimum | 62.2% | 62.8% |
| Maximum | 100.0% | 100.0% |
| Range | 37.8% | 37.2% |
| Mean | 84.1% | 84.0% |
| Median | 84.5% | 85.3% |
| Interquartile 25% (IQ1) | 81.4% | 79.2% |
| Interquartile 75% (IQ3) | 86.8% | 88.0% |
| Interquartile Range (IQR) | 5.4% | 8.8% |
| Standard Deviation (Sample) | 5.9% | 7.2% |
| Standard Deviation (Population) | 5.8% | 7.1% |
Similar Demographics by In Labor Force | Age 30-34
Demographics Similar to Immigrants from Guyana by In Labor Force | Age 30-34
In terms of in labor force | age 30-34, the demographic groups most similar to Immigrants from Guyana are Dominican (83.8%, a difference of 0.0%), Guyanese (83.8%, a difference of 0.020%), Immigrants from Dominican Republic (83.8%, a difference of 0.030%), Honduran (83.8%, a difference of 0.050%), and Scotch-Irish (83.8%, a difference of 0.050%).
| Demographics | Rating | Rank | In Labor Force | Age 30-34 |
| Immigrants | Lebanon | 0.4 /100 | #256 | Tragic 83.9% |
| Iraqis | 0.3 /100 | #257 | Tragic 83.8% |
| Hondurans | 0.3 /100 | #258 | Tragic 83.8% |
| Scotch-Irish | 0.3 /100 | #259 | Tragic 83.8% |
| Immigrants | Dominican Republic | 0.3 /100 | #260 | Tragic 83.8% |
| Guyanese | 0.3 /100 | #261 | Tragic 83.8% |
| Dominicans | 0.2 /100 | #262 | Tragic 83.8% |
| Immigrants | Guyana | 0.2 /100 | #263 | Tragic 83.8% |
| Guatemalans | 0.2 /100 | #264 | Tragic 83.7% |
| Immigrants | Honduras | 0.1 /100 | #265 | Tragic 83.7% |
| Immigrants | Guatemala | 0.1 /100 | #266 | Tragic 83.7% |
| Spaniards | 0.1 /100 | #267 | Tragic 83.6% |
| Immigrants | Bangladesh | 0.1 /100 | #268 | Tragic 83.6% |
| Vietnamese | 0.1 /100 | #269 | Tragic 83.6% |
| Spanish Americans | 0.0 /100 | #270 | Tragic 83.5% |
Demographics Similar to Immigrants from Portugal by In Labor Force | Age 30-34
In terms of in labor force | age 30-34, the demographic groups most similar to Immigrants from Portugal are Immigrants from Oceania (84.0%, a difference of 0.010%), English (84.0%, a difference of 0.020%), Venezuelan (84.0%, a difference of 0.020%), Immigrants from Caribbean (84.0%, a difference of 0.020%), and Celtic (84.1%, a difference of 0.030%).
| Demographics | Rating | Rank | In Labor Force | Age 30-34 |
| Haitians | 1.8 /100 | #234 | Tragic 84.1% |
| French American Indians | 1.7 /100 | #235 | Tragic 84.1% |
| U.S. Virgin Islanders | 1.5 /100 | #236 | Tragic 84.1% |
| Celtics | 1.4 /100 | #237 | Tragic 84.1% |
| Immigrants | Barbados | 1.4 /100 | #238 | Tragic 84.0% |
| English | 1.4 /100 | #239 | Tragic 84.0% |
| Venezuelans | 1.3 /100 | #240 | Tragic 84.0% |
| Immigrants | Portugal | 1.2 /100 | #241 | Tragic 84.0% |
| Immigrants | Oceania | 1.1 /100 | #242 | Tragic 84.0% |
| Immigrants | Caribbean | 1.1 /100 | #243 | Tragic 84.0% |
| Basques | 0.9 /100 | #244 | Tragic 84.0% |
| Immigrants | Venezuela | 0.9 /100 | #245 | Tragic 84.0% |
| Central Americans | 0.9 /100 | #246 | Tragic 84.0% |
| British West Indians | 0.8 /100 | #247 | Tragic 84.0% |
| Portuguese | 0.8 /100 | #248 | Tragic 84.0% |