Immigrants from Uruguay vs Okinawan In Labor Force | Age 30-34
COMPARE
Immigrants from Uruguay
Okinawan
In Labor Force | Age 30-34
In Labor Force | Age 30-34 Comparison
Immigrants from Uruguay
Okinawans
84.7%
IN LABOR FORCE | AGE 30-34
57.4/ 100
METRIC RATING
163rd/ 347
METRIC RANK
84.6%
IN LABOR FORCE | AGE 30-34
44.1/ 100
METRIC RATING
178th/ 347
METRIC RANK
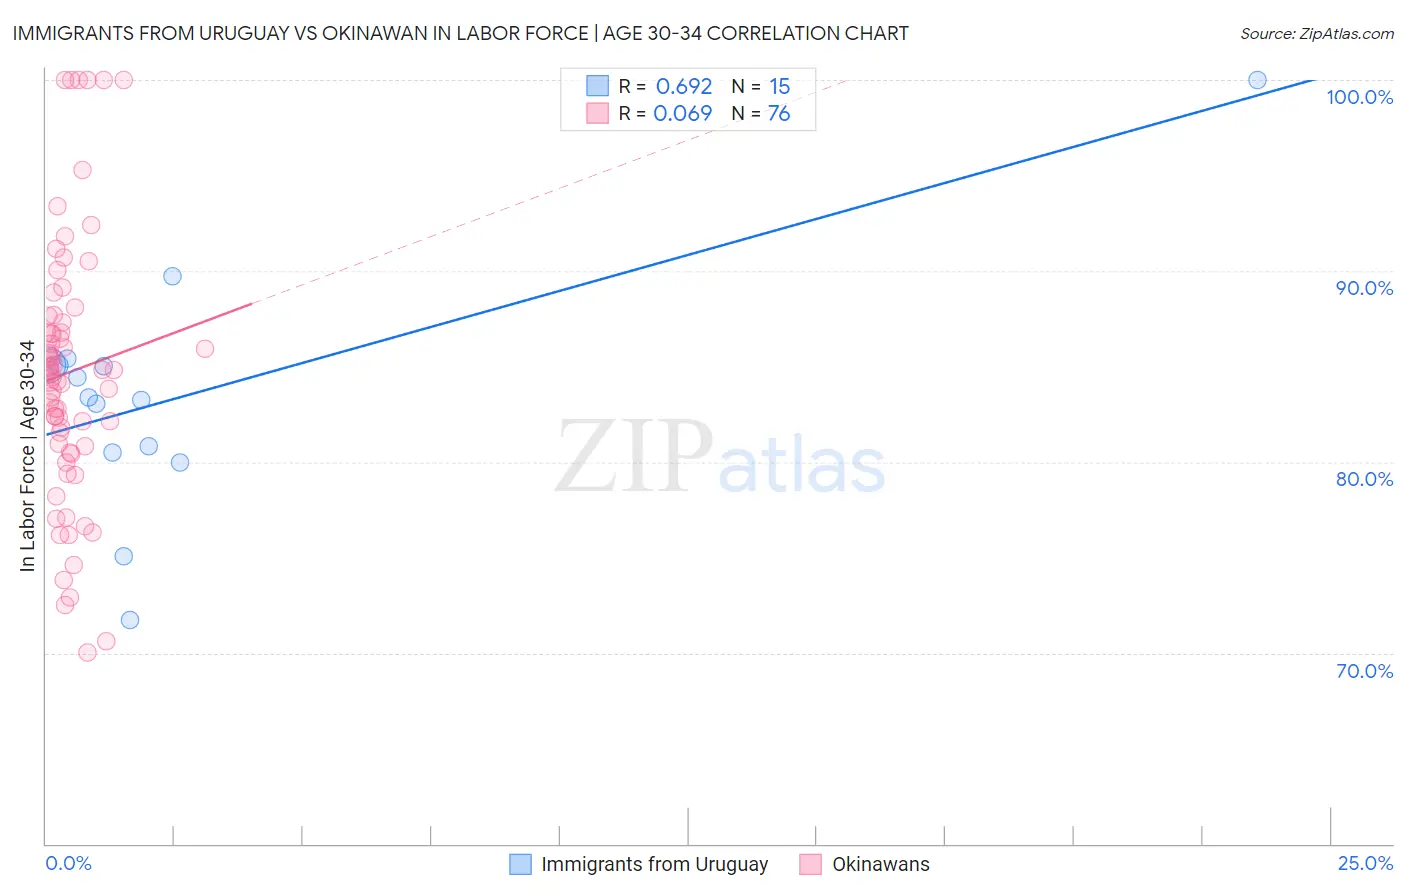
Immigrants from Uruguay vs Okinawan In Labor Force | Age 30-34 Correlation Chart
The statistical analysis conducted on geographies consisting of 133,242,034 people shows a significant positive correlation between the proportion of Immigrants from Uruguay and labor force participation rate among population between the ages 30 and 34 in the United States with a correlation coefficient (R) of 0.692 and weighted average of 84.7%. Similarly, the statistical analysis conducted on geographies consisting of 73,721,910 people shows a slight positive correlation between the proportion of Okinawans and labor force participation rate among population between the ages 30 and 34 in the United States with a correlation coefficient (R) of 0.069 and weighted average of 84.6%, a difference of 0.090%.
In Labor Force | Age 30-34 Correlation Summary
| Measurement | Immigrants from Uruguay | Okinawan |
| Minimum | 71.7% | 70.0% |
| Maximum | 100.0% | 100.0% |
| Range | 28.3% | 30.0% |
| Mean | 83.5% | 84.7% |
| Median | 83.4% | 84.7% |
| Interquartile 25% (IQ1) | 80.5% | 80.9% |
| Interquartile 75% (IQ3) | 85.1% | 87.5% |
| Interquartile Range (IQR) | 4.6% | 6.6% |
| Standard Deviation (Sample) | 6.3% | 6.8% |
| Standard Deviation (Population) | 6.1% | 6.8% |
Demographics Similar to Immigrants from Uruguay and Okinawans by In Labor Force | Age 30-34
In terms of in labor force | age 30-34, the demographic groups most similar to Immigrants from Uruguay are Icelander (84.7%, a difference of 0.0%), South American (84.7%, a difference of 0.010%), Immigrants from Western Europe (84.7%, a difference of 0.010%), Pakistani (84.7%, a difference of 0.020%), and Immigrants from Cambodia (84.7%, a difference of 0.020%). Similarly, the demographic groups most similar to Okinawans are Immigrants from Nigeria (84.6%, a difference of 0.010%), Immigrants from Netherlands (84.6%, a difference of 0.010%), Laotian (84.7%, a difference of 0.020%), Finnish (84.7%, a difference of 0.040%), and Immigrants from South America (84.7%, a difference of 0.040%).
| Demographics | Rating | Rank | In Labor Force | Age 30-34 |
| Pakistanis | 60.8 /100 | #160 | Good 84.7% |
| Immigrants | Cambodia | 60.7 /100 | #161 | Good 84.7% |
| South Americans | 58.7 /100 | #162 | Average 84.7% |
| Immigrants | Uruguay | 57.4 /100 | #163 | Average 84.7% |
| Icelanders | 56.8 /100 | #164 | Average 84.7% |
| Immigrants | Western Europe | 56.7 /100 | #165 | Average 84.7% |
| Afghans | 55.2 /100 | #166 | Average 84.7% |
| Immigrants | South Eastern Asia | 54.2 /100 | #167 | Average 84.7% |
| Immigrants | Peru | 52.4 /100 | #168 | Average 84.7% |
| South American Indians | 52.1 /100 | #169 | Average 84.7% |
| Immigrants | Burma/Myanmar | 52.0 /100 | #170 | Average 84.7% |
| Irish | 52.0 /100 | #171 | Average 84.7% |
| Immigrants | England | 51.7 /100 | #172 | Average 84.7% |
| Israelis | 51.1 /100 | #173 | Average 84.7% |
| Finns | 50.0 /100 | #174 | Average 84.7% |
| Immigrants | South America | 50.0 /100 | #175 | Average 84.7% |
| Immigrants | Uzbekistan | 49.1 /100 | #176 | Average 84.7% |
| Laotians | 46.9 /100 | #177 | Average 84.7% |
| Okinawans | 44.1 /100 | #178 | Average 84.6% |
| Immigrants | Nigeria | 42.5 /100 | #179 | Average 84.6% |
| Immigrants | Netherlands | 42.1 /100 | #180 | Average 84.6% |