Cree vs Spanish In Labor Force | Age 45-54
COMPARE
Cree
Spanish
In Labor Force | Age 45-54
In Labor Force | Age 45-54 Comparison
Cree
Spanish
80.8%
IN LABOR FORCE | AGE 45-54
0.0/ 100
METRIC RATING
288th/ 347
METRIC RANK
81.3%
IN LABOR FORCE | AGE 45-54
0.0/ 100
METRIC RATING
272nd/ 347
METRIC RANK
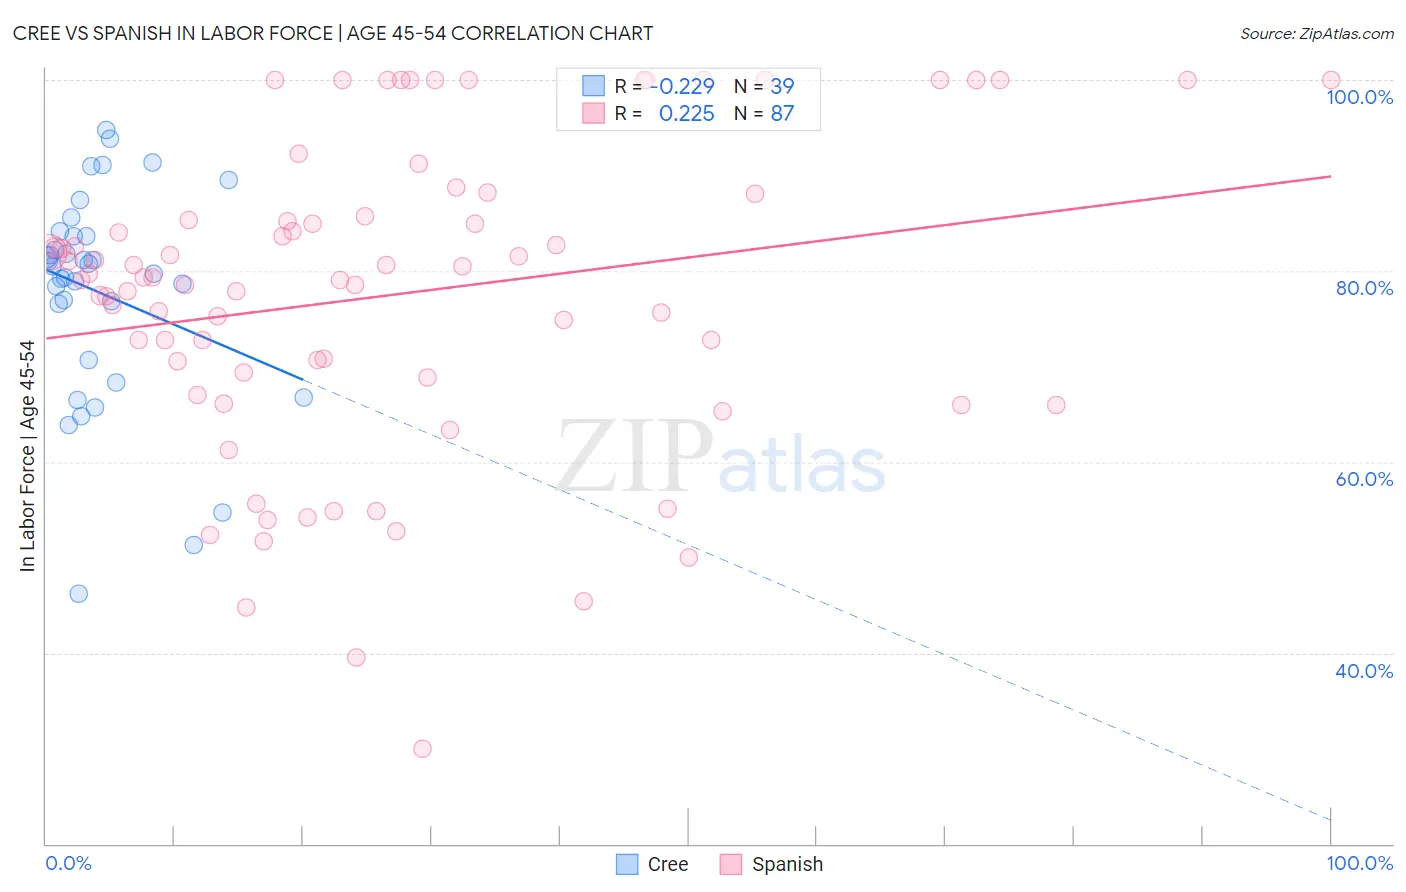
Cree vs Spanish In Labor Force | Age 45-54 Correlation Chart
The statistical analysis conducted on geographies consisting of 76,209,843 people shows a weak negative correlation between the proportion of Cree and labor force participation rate among population between the ages 45 and 54 in the United States with a correlation coefficient (R) of -0.229 and weighted average of 80.8%. Similarly, the statistical analysis conducted on geographies consisting of 421,899,220 people shows a weak positive correlation between the proportion of Spanish and labor force participation rate among population between the ages 45 and 54 in the United States with a correlation coefficient (R) of 0.225 and weighted average of 81.3%, a difference of 0.67%.
In Labor Force | Age 45-54 Correlation Summary
| Measurement | Cree | Spanish |
| Minimum | 46.2% | 30.0% |
| Maximum | 94.7% | 100.0% |
| Range | 48.5% | 70.0% |
| Mean | 77.7% | 77.5% |
| Median | 80.5% | 79.3% |
| Interquartile 25% (IQ1) | 70.6% | 68.8% |
| Interquartile 75% (IQ3) | 83.6% | 85.7% |
| Interquartile Range (IQR) | 13.0% | 16.9% |
| Standard Deviation (Sample) | 11.2% | 16.2% |
| Standard Deviation (Population) | 11.0% | 16.1% |
Demographics Similar to Cree and Spanish by In Labor Force | Age 45-54
In terms of in labor force | age 45-54, the demographic groups most similar to Cree are Vietnamese (80.8%, a difference of 0.0%), Delaware (80.8%, a difference of 0.010%), Immigrants from Dominica (80.8%, a difference of 0.010%), Belizean (80.8%, a difference of 0.020%), and Immigrants from Bangladesh (80.7%, a difference of 0.030%). Similarly, the demographic groups most similar to Spanish are Bangladeshi (81.3%, a difference of 0.010%), Immigrants from Barbados (81.3%, a difference of 0.010%), Chippewa (81.3%, a difference of 0.060%), British West Indian (81.2%, a difference of 0.10%), and Nonimmigrants (81.2%, a difference of 0.10%).
| Demographics | Rating | Rank | In Labor Force | Age 45-54 |
| Bangladeshis | 0.0 /100 | #270 | Tragic 81.3% |
| Immigrants | Barbados | 0.0 /100 | #271 | Tragic 81.3% |
| Spanish | 0.0 /100 | #272 | Tragic 81.3% |
| Chippewa | 0.0 /100 | #273 | Tragic 81.3% |
| British West Indians | 0.0 /100 | #274 | Tragic 81.2% |
| Immigrants | Nonimmigrants | 0.0 /100 | #275 | Tragic 81.2% |
| U.S. Virgin Islanders | 0.0 /100 | #276 | Tragic 81.2% |
| Guatemalans | 0.0 /100 | #277 | Tragic 81.2% |
| Immigrants | Guatemala | 0.0 /100 | #278 | Tragic 81.1% |
| Immigrants | Micronesia | 0.0 /100 | #279 | Tragic 81.1% |
| Immigrants | Latin America | 0.0 /100 | #280 | Tragic 81.0% |
| Immigrants | Grenada | 0.0 /100 | #281 | Tragic 81.0% |
| Aleuts | 0.0 /100 | #282 | Tragic 81.0% |
| French American Indians | 0.0 /100 | #283 | Tragic 80.8% |
| Belizeans | 0.0 /100 | #284 | Tragic 80.8% |
| Delaware | 0.0 /100 | #285 | Tragic 80.8% |
| Immigrants | Dominica | 0.0 /100 | #286 | Tragic 80.8% |
| Vietnamese | 0.0 /100 | #287 | Tragic 80.8% |
| Cree | 0.0 /100 | #288 | Tragic 80.8% |
| Immigrants | Bangladesh | 0.0 /100 | #289 | Tragic 80.7% |
| Mexican American Indians | 0.0 /100 | #290 | Tragic 80.7% |