Cree vs Spanish American In Labor Force | Age 45-54
COMPARE
Cree
Spanish American
In Labor Force | Age 45-54
In Labor Force | Age 45-54 Comparison
Cree
Spanish Americans
80.8%
IN LABOR FORCE | AGE 45-54
0.0/ 100
METRIC RATING
288th/ 347
METRIC RANK
80.1%
IN LABOR FORCE | AGE 45-54
0.0/ 100
METRIC RATING
306th/ 347
METRIC RANK
Cree vs Spanish American In Labor Force | Age 45-54 Correlation Chart
The statistical analysis conducted on geographies consisting of 76,209,843 people shows a weak negative correlation between the proportion of Cree and labor force participation rate among population between the ages 45 and 54 in the United States with a correlation coefficient (R) of -0.229 and weighted average of 80.8%. Similarly, the statistical analysis conducted on geographies consisting of 103,159,967 people shows a weak positive correlation between the proportion of Spanish Americans and labor force participation rate among population between the ages 45 and 54 in the United States with a correlation coefficient (R) of 0.226 and weighted average of 80.1%, a difference of 0.87%.
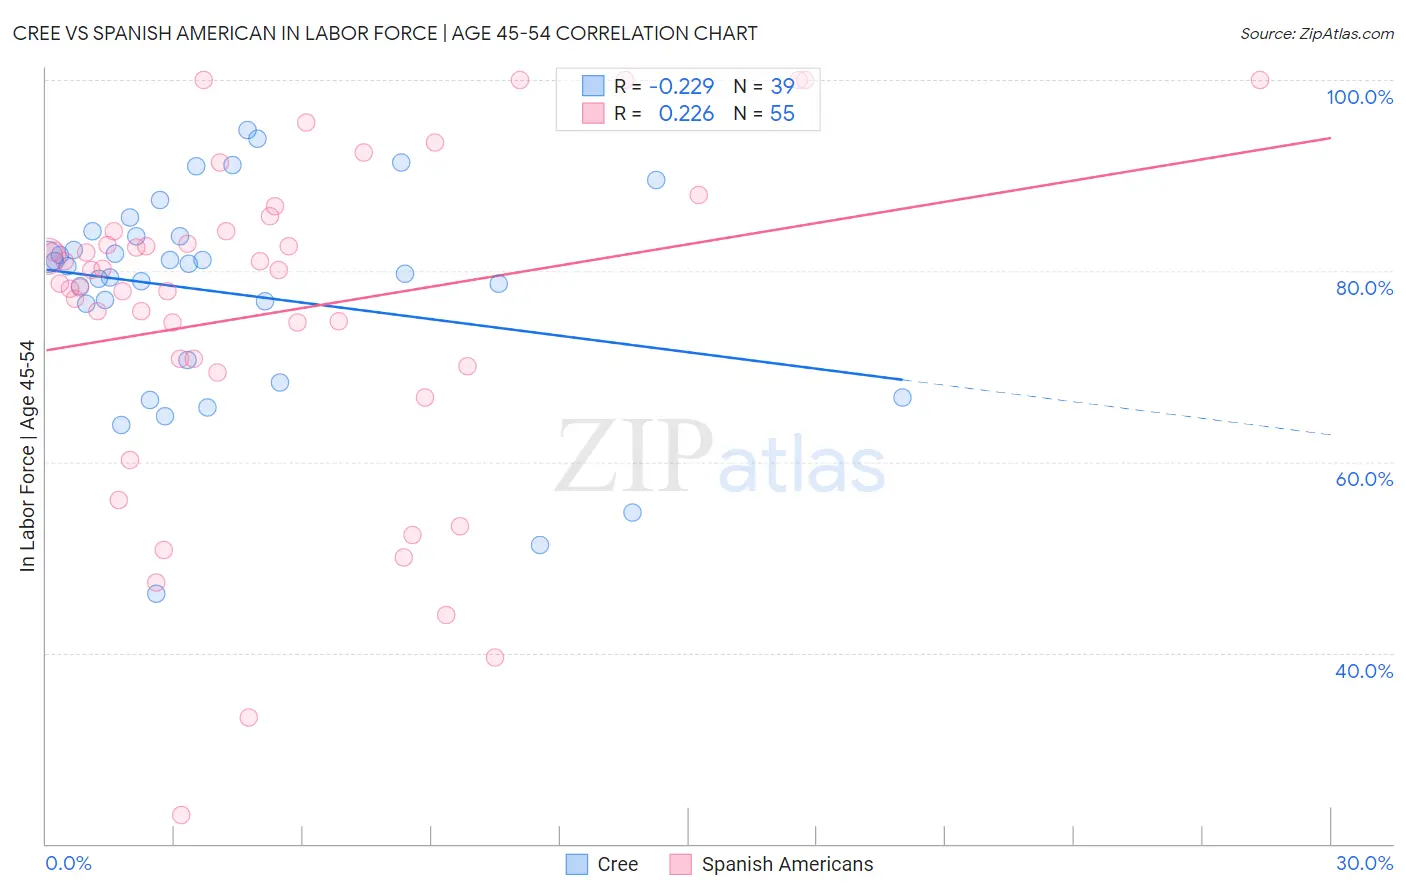
In Labor Force | Age 45-54 Correlation Summary
| Measurement | Cree | Spanish American |
| Minimum | 46.2% | 23.0% |
| Maximum | 94.7% | 100.0% |
| Range | 48.5% | 77.0% |
| Mean | 77.7% | 75.7% |
| Median | 80.5% | 80.1% |
| Interquartile 25% (IQ1) | 70.6% | 70.0% |
| Interquartile 75% (IQ3) | 83.6% | 84.1% |
| Interquartile Range (IQR) | 13.0% | 14.1% |
| Standard Deviation (Sample) | 11.2% | 17.6% |
| Standard Deviation (Population) | 11.0% | 17.4% |
Demographics Similar to Cree and Spanish Americans by In Labor Force | Age 45-54
In terms of in labor force | age 45-54, the demographic groups most similar to Cree are Vietnamese (80.8%, a difference of 0.0%), Immigrants from Bangladesh (80.7%, a difference of 0.030%), Mexican American Indian (80.7%, a difference of 0.060%), Immigrants from Belize (80.6%, a difference of 0.16%), and Iroquois (80.6%, a difference of 0.19%). Similarly, the demographic groups most similar to Spanish Americans are Immigrants from Dominican Republic (80.1%, a difference of 0.040%), Hispanic or Latino (80.1%, a difference of 0.050%), Immigrants from the Azores (80.1%, a difference of 0.070%), Blackfeet (80.0%, a difference of 0.080%), and Immigrants from Central America (80.2%, a difference of 0.14%).
| Demographics | Rating | Rank | In Labor Force | Age 45-54 |
| Vietnamese | 0.0 /100 | #287 | Tragic 80.8% |
| Cree | 0.0 /100 | #288 | Tragic 80.8% |
| Immigrants | Bangladesh | 0.0 /100 | #289 | Tragic 80.7% |
| Mexican American Indians | 0.0 /100 | #290 | Tragic 80.7% |
| Immigrants | Belize | 0.0 /100 | #291 | Tragic 80.6% |
| Iroquois | 0.0 /100 | #292 | Tragic 80.6% |
| Osage | 0.0 /100 | #293 | Tragic 80.6% |
| Yakama | 0.0 /100 | #294 | Tragic 80.6% |
| Nepalese | 0.0 /100 | #295 | Tragic 80.5% |
| Africans | 0.0 /100 | #296 | Tragic 80.5% |
| Americans | 0.0 /100 | #297 | Tragic 80.4% |
| Marshallese | 0.0 /100 | #298 | Tragic 80.3% |
| Dominicans | 0.0 /100 | #299 | Tragic 80.3% |
| Fijians | 0.0 /100 | #300 | Tragic 80.2% |
| Spanish American Indians | 0.0 /100 | #301 | Tragic 80.2% |
| Immigrants | Central America | 0.0 /100 | #302 | Tragic 80.2% |
| Immigrants | Azores | 0.0 /100 | #303 | Tragic 80.1% |
| Hispanics or Latinos | 0.0 /100 | #304 | Tragic 80.1% |
| Immigrants | Dominican Republic | 0.0 /100 | #305 | Tragic 80.1% |
| Spanish Americans | 0.0 /100 | #306 | Tragic 80.1% |
| Blackfeet | 0.0 /100 | #307 | Tragic 80.0% |