Indonesian vs Slovak In Labor Force | Age 45-54
COMPARE
Indonesian
Slovak
In Labor Force | Age 45-54
In Labor Force | Age 45-54 Comparison
Indonesians
Slovaks
81.5%
IN LABOR FORCE | AGE 45-54
0.1/ 100
METRIC RATING
263rd/ 347
METRIC RANK
83.2%
IN LABOR FORCE | AGE 45-54
92.8/ 100
METRIC RATING
108th/ 347
METRIC RANK
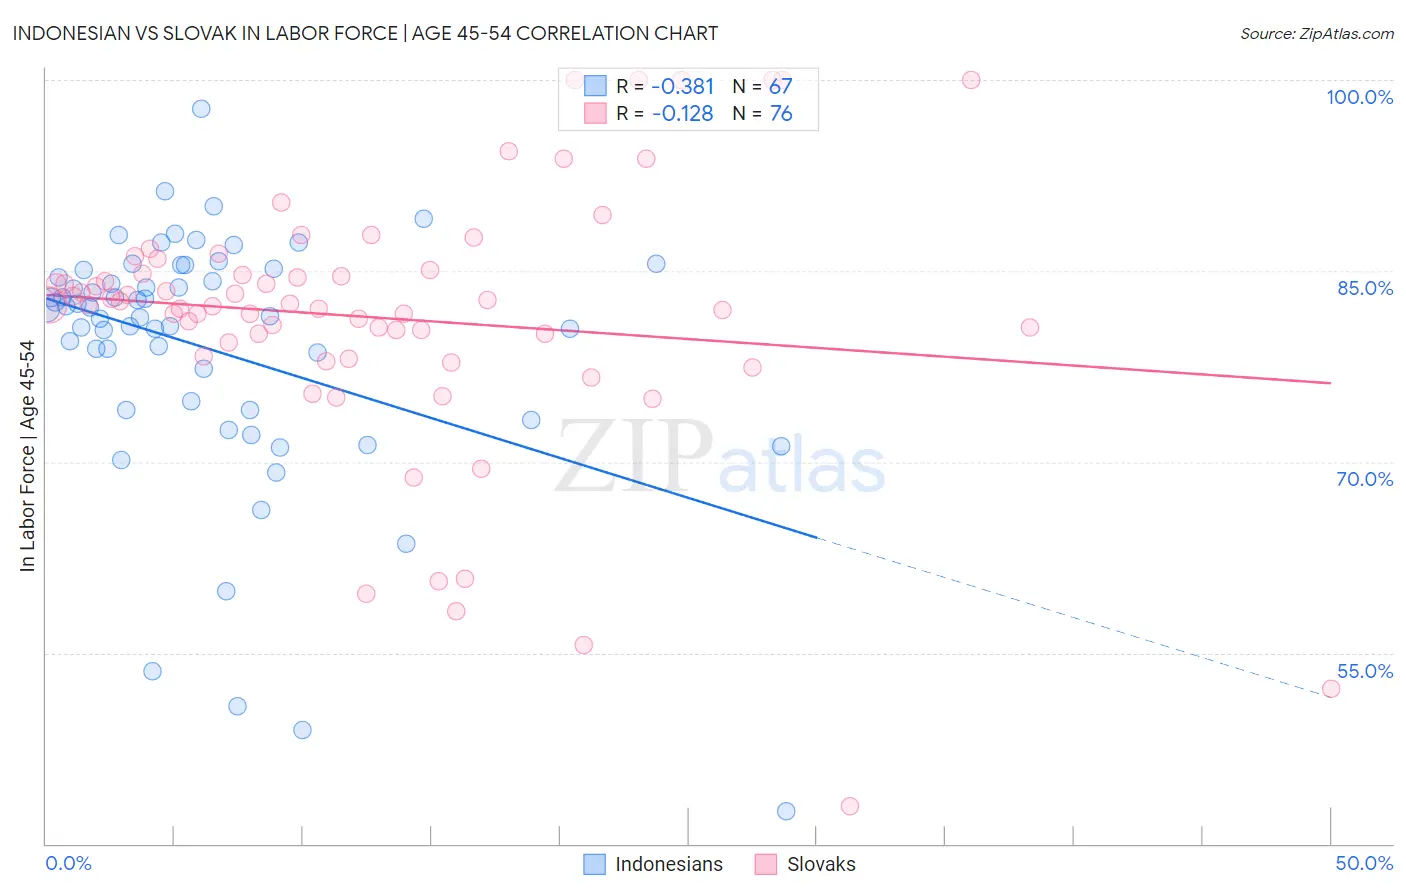
Indonesian vs Slovak In Labor Force | Age 45-54 Correlation Chart
The statistical analysis conducted on geographies consisting of 162,640,204 people shows a mild negative correlation between the proportion of Indonesians and labor force participation rate among population between the ages 45 and 54 in the United States with a correlation coefficient (R) of -0.381 and weighted average of 81.5%. Similarly, the statistical analysis conducted on geographies consisting of 397,668,603 people shows a poor negative correlation between the proportion of Slovaks and labor force participation rate among population between the ages 45 and 54 in the United States with a correlation coefficient (R) of -0.128 and weighted average of 83.2%, a difference of 2.1%.
In Labor Force | Age 45-54 Correlation Summary
| Measurement | Indonesian | Slovak |
| Minimum | 42.6% | 42.9% |
| Maximum | 97.7% | 100.0% |
| Range | 55.1% | 57.1% |
| Mean | 78.8% | 81.3% |
| Median | 81.9% | 82.4% |
| Interquartile 25% (IQ1) | 74.1% | 78.8% |
| Interquartile 75% (IQ3) | 85.0% | 84.9% |
| Interquartile Range (IQR) | 10.9% | 6.1% |
| Standard Deviation (Sample) | 10.1% | 10.6% |
| Standard Deviation (Population) | 10.0% | 10.5% |
Similar Demographics by In Labor Force | Age 45-54
Demographics Similar to Indonesians by In Labor Force | Age 45-54
In terms of in labor force | age 45-54, the demographic groups most similar to Indonesians are Hawaiian (81.5%, a difference of 0.010%), Immigrants from Guyana (81.5%, a difference of 0.010%), Immigrants from West Indies (81.5%, a difference of 0.010%), Spaniard (81.5%, a difference of 0.030%), and Guyanese (81.5%, a difference of 0.050%).
| Demographics | Rating | Rank | In Labor Force | Age 45-54 |
| Barbadians | 0.1 /100 | #256 | Tragic 81.6% |
| Immigrants | Congo | 0.1 /100 | #257 | Tragic 81.6% |
| Immigrants | Fiji | 0.1 /100 | #258 | Tragic 81.5% |
| Guyanese | 0.1 /100 | #259 | Tragic 81.5% |
| Spaniards | 0.1 /100 | #260 | Tragic 81.5% |
| Hawaiians | 0.1 /100 | #261 | Tragic 81.5% |
| Immigrants | Guyana | 0.1 /100 | #262 | Tragic 81.5% |
| Indonesians | 0.1 /100 | #263 | Tragic 81.5% |
| Immigrants | West Indies | 0.1 /100 | #264 | Tragic 81.5% |
| Hondurans | 0.1 /100 | #265 | Tragic 81.4% |
| Immigrants | St. Vincent and the Grenadines | 0.1 /100 | #266 | Tragic 81.4% |
| West Indians | 0.1 /100 | #267 | Tragic 81.4% |
| Immigrants | Honduras | 0.0 /100 | #268 | Tragic 81.4% |
| Alsatians | 0.0 /100 | #269 | Tragic 81.3% |
| Bangladeshis | 0.0 /100 | #270 | Tragic 81.3% |
Demographics Similar to Slovaks by In Labor Force | Age 45-54
In terms of in labor force | age 45-54, the demographic groups most similar to Slovaks are Iranian (83.2%, a difference of 0.0%), Ukrainian (83.2%, a difference of 0.0%), Immigrants from Africa (83.2%, a difference of 0.0%), Sri Lankan (83.2%, a difference of 0.010%), and Immigrants from Italy (83.2%, a difference of 0.010%).
| Demographics | Rating | Rank | In Labor Force | Age 45-54 |
| Immigrants | Belarus | 94.1 /100 | #101 | Exceptional 83.3% |
| Immigrants | Singapore | 93.9 /100 | #102 | Exceptional 83.3% |
| Albanians | 93.9 /100 | #103 | Exceptional 83.3% |
| Immigrants | Romania | 93.8 /100 | #104 | Exceptional 83.3% |
| Immigrants | South America | 93.5 /100 | #105 | Exceptional 83.2% |
| Sri Lankans | 93.2 /100 | #106 | Exceptional 83.2% |
| Iranians | 92.9 /100 | #107 | Exceptional 83.2% |
| Slovaks | 92.8 /100 | #108 | Exceptional 83.2% |
| Ukrainians | 92.7 /100 | #109 | Exceptional 83.2% |
| Immigrants | Africa | 92.6 /100 | #110 | Exceptional 83.2% |
| Immigrants | Italy | 92.5 /100 | #111 | Exceptional 83.2% |
| Immigrants | Afghanistan | 92.4 /100 | #112 | Exceptional 83.2% |
| Immigrants | Albania | 91.8 /100 | #113 | Exceptional 83.2% |
| Assyrians/Chaldeans/Syriacs | 91.7 /100 | #114 | Exceptional 83.2% |
| Immigrants | Chile | 91.6 /100 | #115 | Exceptional 83.2% |