Colombian vs Ugandan In Labor Force | Age 20-64
COMPARE
Colombian
Ugandan
In Labor Force | Age 20-64
In Labor Force | Age 20-64 Comparison
Colombians
Ugandans
80.1%
IN LABOR FORCE | AGE 20-64
97.3/ 100
METRIC RATING
83rd/ 347
METRIC RANK
80.6%
IN LABOR FORCE | AGE 20-64
99.8/ 100
METRIC RATING
38th/ 347
METRIC RANK
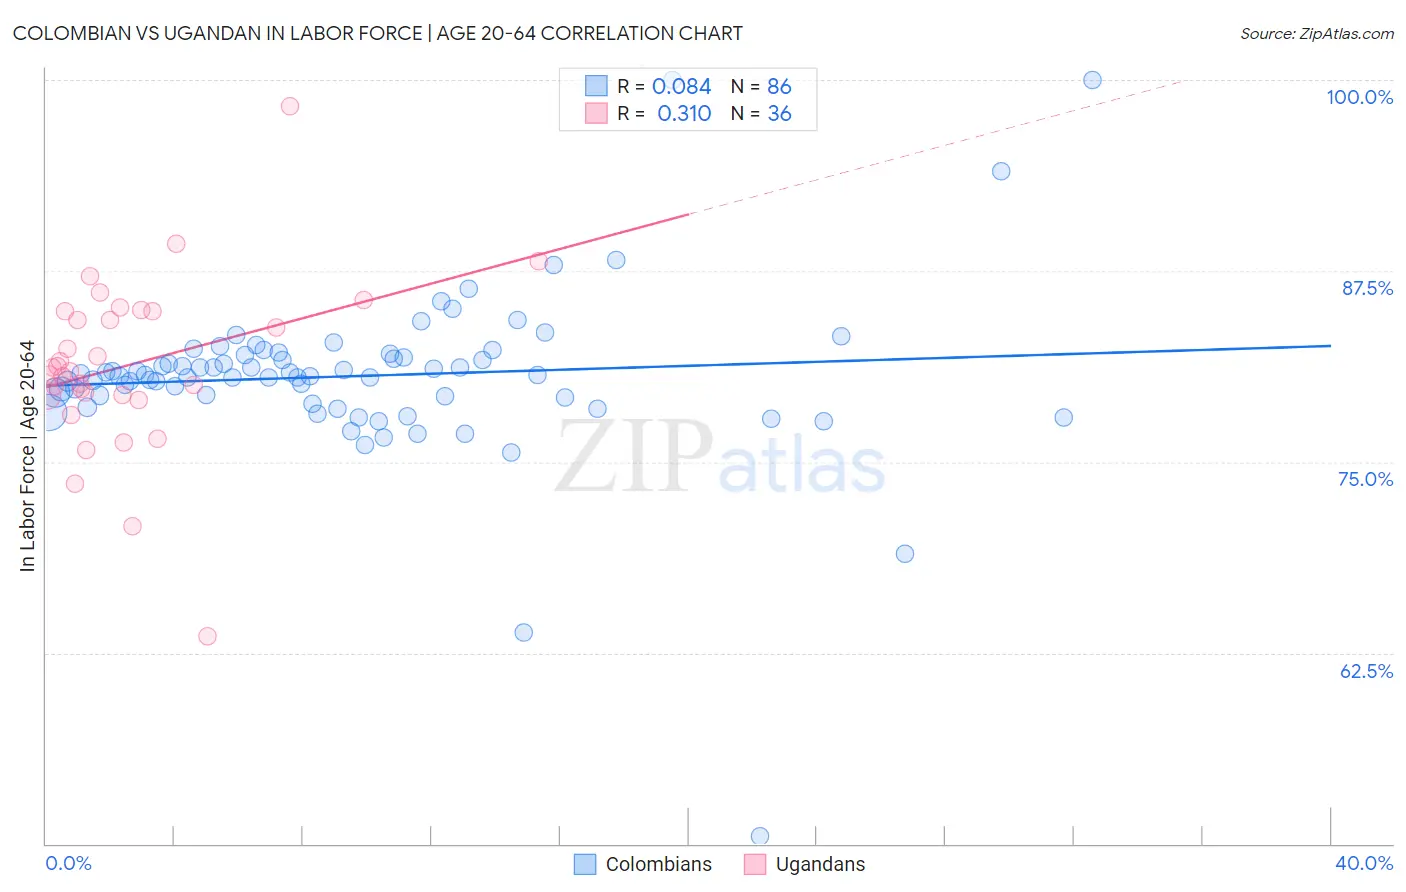
Colombian vs Ugandan In Labor Force | Age 20-64 Correlation Chart
The statistical analysis conducted on geographies consisting of 419,691,663 people shows a slight positive correlation between the proportion of Colombians and labor force participation rate among population between the ages 20 and 64 in the United States with a correlation coefficient (R) of 0.084 and weighted average of 80.1%. Similarly, the statistical analysis conducted on geographies consisting of 94,018,069 people shows a mild positive correlation between the proportion of Ugandans and labor force participation rate among population between the ages 20 and 64 in the United States with a correlation coefficient (R) of 0.310 and weighted average of 80.6%, a difference of 0.53%.
In Labor Force | Age 20-64 Correlation Summary
| Measurement | Colombian | Ugandan |
| Minimum | 50.5% | 63.6% |
| Maximum | 100.0% | 98.3% |
| Range | 49.5% | 34.7% |
| Mean | 80.6% | 81.4% |
| Median | 80.7% | 81.0% |
| Interquartile 25% (IQ1) | 79.2% | 79.4% |
| Interquartile 75% (IQ3) | 82.0% | 84.9% |
| Interquartile Range (IQR) | 2.8% | 5.5% |
| Standard Deviation (Sample) | 5.7% | 5.7% |
| Standard Deviation (Population) | 5.6% | 5.7% |
Similar Demographics by In Labor Force | Age 20-64
Demographics Similar to Colombians by In Labor Force | Age 20-64
In terms of in labor force | age 20-64, the demographic groups most similar to Colombians are German Russian (80.1%, a difference of 0.0%), Immigrants from Japan (80.1%, a difference of 0.0%), Immigrants from Latvia (80.1%, a difference of 0.0%), Jordanian (80.1%, a difference of 0.010%), and Immigrants from Egypt (80.1%, a difference of 0.010%).
| Demographics | Rating | Rank | In Labor Force | Age 20-64 |
| Egyptians | 97.8 /100 | #76 | Exceptional 80.2% |
| Immigrants | Colombia | 97.8 /100 | #77 | Exceptional 80.2% |
| Immigrants | Romania | 97.8 /100 | #78 | Exceptional 80.2% |
| Asians | 97.7 /100 | #79 | Exceptional 80.2% |
| Immigrants | Croatia | 97.6 /100 | #80 | Exceptional 80.1% |
| German Russians | 97.3 /100 | #81 | Exceptional 80.1% |
| Immigrants | Japan | 97.3 /100 | #82 | Exceptional 80.1% |
| Colombians | 97.3 /100 | #83 | Exceptional 80.1% |
| Immigrants | Latvia | 97.2 /100 | #84 | Exceptional 80.1% |
| Jordanians | 97.2 /100 | #85 | Exceptional 80.1% |
| Immigrants | Egypt | 97.1 /100 | #86 | Exceptional 80.1% |
| Croatians | 97.1 /100 | #87 | Exceptional 80.1% |
| Chileans | 97.0 /100 | #88 | Exceptional 80.1% |
| Immigrants | Venezuela | 96.8 /100 | #89 | Exceptional 80.1% |
| Poles | 96.8 /100 | #90 | Exceptional 80.1% |
Demographics Similar to Ugandans by In Labor Force | Age 20-64
In terms of in labor force | age 20-64, the demographic groups most similar to Ugandans are Brazilian (80.5%, a difference of 0.010%), Immigrants from Zimbabwe (80.5%, a difference of 0.010%), Paraguayan (80.6%, a difference of 0.020%), Immigrants from Moldova (80.6%, a difference of 0.020%), and Immigrants from Liberia (80.5%, a difference of 0.020%).
| Demographics | Rating | Rank | In Labor Force | Age 20-64 |
| Immigrants | Lithuania | 99.9 /100 | #31 | Exceptional 80.7% |
| Immigrants | Ireland | 99.9 /100 | #32 | Exceptional 80.7% |
| Chinese | 99.9 /100 | #33 | Exceptional 80.7% |
| Immigrants | Brazil | 99.9 /100 | #34 | Exceptional 80.7% |
| Immigrants | Poland | 99.9 /100 | #35 | Exceptional 80.6% |
| Paraguayans | 99.8 /100 | #36 | Exceptional 80.6% |
| Immigrants | Moldova | 99.8 /100 | #37 | Exceptional 80.6% |
| Ugandans | 99.8 /100 | #38 | Exceptional 80.6% |
| Brazilians | 99.8 /100 | #39 | Exceptional 80.5% |
| Immigrants | Zimbabwe | 99.8 /100 | #40 | Exceptional 80.5% |
| Immigrants | Liberia | 99.8 /100 | #41 | Exceptional 80.5% |
| Latvians | 99.8 /100 | #42 | Exceptional 80.5% |
| Czechs | 99.7 /100 | #43 | Exceptional 80.5% |
| Immigrants | Middle Africa | 99.7 /100 | #44 | Exceptional 80.5% |
| Slovenes | 99.7 /100 | #45 | Exceptional 80.5% |