Colombian vs Greek In Labor Force | Age 20-24
COMPARE
Colombian
Greek
In Labor Force | Age 20-24
In Labor Force | Age 20-24 Comparison
Colombians
Greeks
73.5%
IN LABOR FORCE | AGE 20-24
0.3/ 100
METRIC RATING
269th/ 347
METRIC RANK
76.0%
IN LABOR FORCE | AGE 20-24
96.9/ 100
METRIC RATING
107th/ 347
METRIC RANK
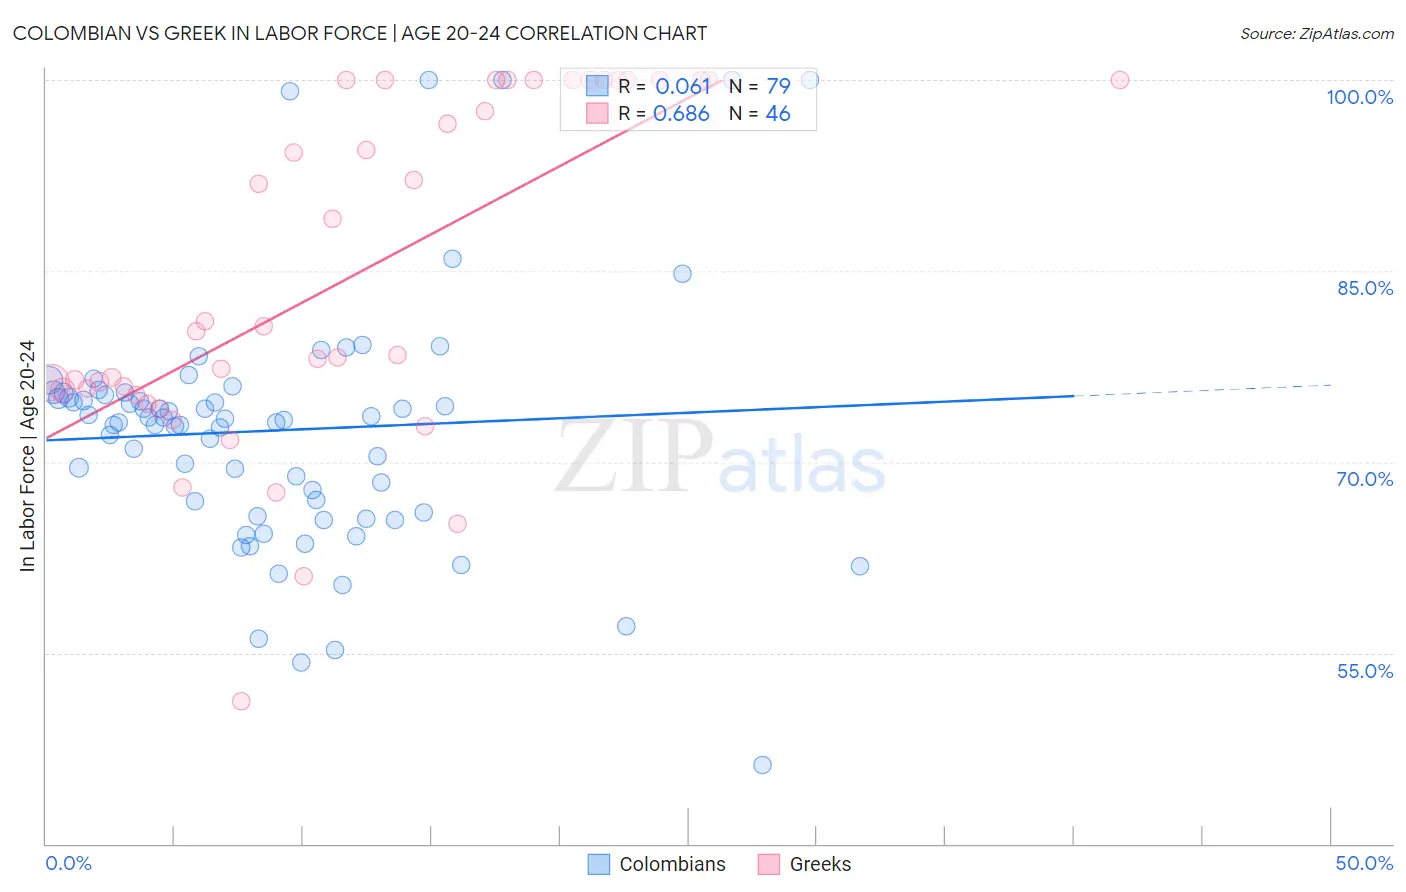
Colombian vs Greek In Labor Force | Age 20-24 Correlation Chart
The statistical analysis conducted on geographies consisting of 419,536,889 people shows a slight positive correlation between the proportion of Colombians and labor force participation rate among population between the ages 20 and 24 in the United States with a correlation coefficient (R) of 0.061 and weighted average of 73.5%. Similarly, the statistical analysis conducted on geographies consisting of 482,371,650 people shows a significant positive correlation between the proportion of Greeks and labor force participation rate among population between the ages 20 and 24 in the United States with a correlation coefficient (R) of 0.686 and weighted average of 76.0%, a difference of 3.4%.
In Labor Force | Age 20-24 Correlation Summary
| Measurement | Colombian | Greek |
| Minimum | 46.2% | 51.2% |
| Maximum | 100.0% | 100.0% |
| Range | 53.8% | 48.8% |
| Mean | 72.5% | 84.7% |
| Median | 73.3% | 80.5% |
| Interquartile 25% (IQ1) | 66.0% | 75.6% |
| Interquartile 75% (IQ3) | 75.4% | 100.0% |
| Interquartile Range (IQR) | 9.4% | 24.4% |
| Standard Deviation (Sample) | 9.9% | 13.4% |
| Standard Deviation (Population) | 9.8% | 13.2% |
Similar Demographics by In Labor Force | Age 20-24
Demographics Similar to Colombians by In Labor Force | Age 20-24
In terms of in labor force | age 20-24, the demographic groups most similar to Colombians are South American (73.5%, a difference of 0.030%), Immigrants from Russia (73.5%, a difference of 0.030%), Immigrants from Western Asia (73.5%, a difference of 0.080%), Immigrants from Indonesia (73.4%, a difference of 0.090%), and Belizean (73.4%, a difference of 0.10%).
| Demographics | Rating | Rank | In Labor Force | Age 20-24 |
| Asians | 0.6 /100 | #262 | Tragic 73.7% |
| Immigrants | Asia | 0.5 /100 | #263 | Tragic 73.6% |
| Immigrants | Haiti | 0.5 /100 | #264 | Tragic 73.6% |
| Burmese | 0.5 /100 | #265 | Tragic 73.6% |
| Haitians | 0.5 /100 | #266 | Tragic 73.6% |
| Immigrants | Western Asia | 0.4 /100 | #267 | Tragic 73.5% |
| South Americans | 0.4 /100 | #268 | Tragic 73.5% |
| Colombians | 0.3 /100 | #269 | Tragic 73.5% |
| Immigrants | Russia | 0.3 /100 | #270 | Tragic 73.5% |
| Immigrants | Indonesia | 0.3 /100 | #271 | Tragic 73.4% |
| Belizeans | 0.3 /100 | #272 | Tragic 73.4% |
| Cheyenne | 0.2 /100 | #273 | Tragic 73.4% |
| Immigrants | Colombia | 0.2 /100 | #274 | Tragic 73.4% |
| Immigrants | South America | 0.2 /100 | #275 | Tragic 73.3% |
| Mongolians | 0.2 /100 | #276 | Tragic 73.3% |
Demographics Similar to Greeks by In Labor Force | Age 20-24
In terms of in labor force | age 20-24, the demographic groups most similar to Greeks are Immigrants from Uganda (76.0%, a difference of 0.030%), Iraqi (76.0%, a difference of 0.030%), Macedonian (76.0%, a difference of 0.040%), Immigrants from Nepal (76.0%, a difference of 0.040%), and Immigrants from North Macedonia (76.1%, a difference of 0.080%).
| Demographics | Rating | Rank | In Labor Force | Age 20-24 |
| Shoshone | 97.8 /100 | #100 | Exceptional 76.1% |
| Immigrants | Poland | 97.7 /100 | #101 | Exceptional 76.1% |
| Latvians | 97.6 /100 | #102 | Exceptional 76.1% |
| Immigrants | North Macedonia | 97.5 /100 | #103 | Exceptional 76.1% |
| Macedonians | 97.2 /100 | #104 | Exceptional 76.0% |
| Immigrants | Nepal | 97.2 /100 | #105 | Exceptional 76.0% |
| Immigrants | Uganda | 97.1 /100 | #106 | Exceptional 76.0% |
| Greeks | 96.9 /100 | #107 | Exceptional 76.0% |
| Iraqis | 96.6 /100 | #108 | Exceptional 76.0% |
| Cherokee | 95.8 /100 | #109 | Exceptional 75.9% |
| Immigrants | Morocco | 95.8 /100 | #110 | Exceptional 75.9% |
| Ukrainians | 95.7 /100 | #111 | Exceptional 75.9% |
| Immigrants | Canada | 95.6 /100 | #112 | Exceptional 75.9% |
| Immigrants | Netherlands | 95.3 /100 | #113 | Exceptional 75.9% |
| Immigrants | Zimbabwe | 95.1 /100 | #114 | Exceptional 75.9% |