Immigrants from Cabo Verde vs Immigrants from Egypt In Labor Force | Age 20-24
COMPARE
Immigrants from Cabo Verde
Immigrants from Egypt
In Labor Force | Age 20-24
In Labor Force | Age 20-24 Comparison
Immigrants from Cabo Verde
Immigrants from Egypt
78.9%
IN LABOR FORCE | AGE 20-24
100.0/ 100
METRIC RATING
8th/ 347
METRIC RANK
73.8%
IN LABOR FORCE | AGE 20-24
1.2/ 100
METRIC RATING
251st/ 347
METRIC RANK
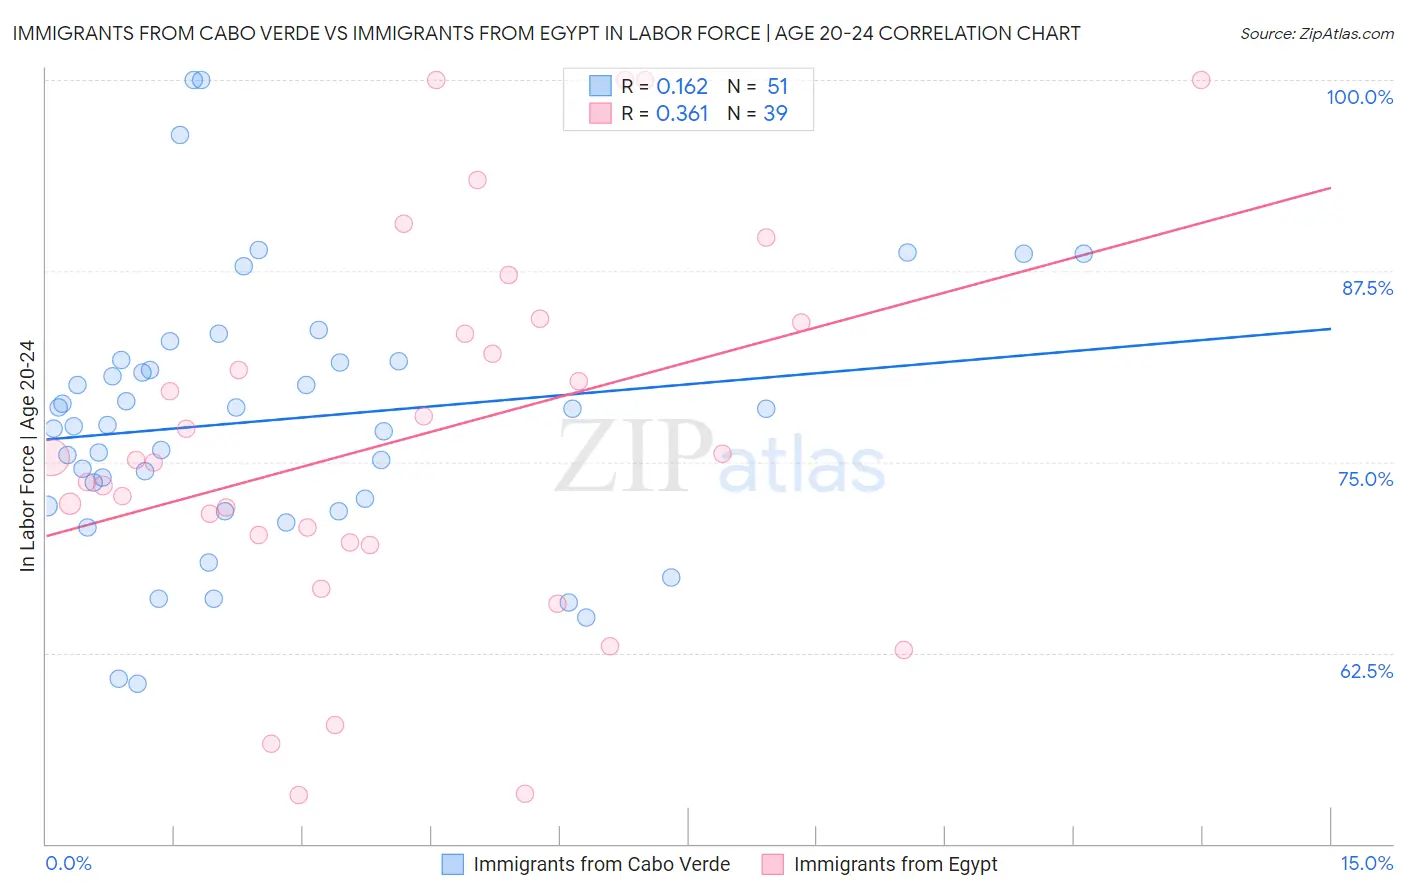
Immigrants from Cabo Verde vs Immigrants from Egypt In Labor Force | Age 20-24 Correlation Chart
The statistical analysis conducted on geographies consisting of 38,158,316 people shows a poor positive correlation between the proportion of Immigrants from Cabo Verde and labor force participation rate among population between the ages 20 and 24 in the United States with a correlation coefficient (R) of 0.162 and weighted average of 78.9%. Similarly, the statistical analysis conducted on geographies consisting of 245,464,045 people shows a mild positive correlation between the proportion of Immigrants from Egypt and labor force participation rate among population between the ages 20 and 24 in the United States with a correlation coefficient (R) of 0.361 and weighted average of 73.8%, a difference of 6.8%.
In Labor Force | Age 20-24 Correlation Summary
| Measurement | Immigrants from Cabo Verde | Immigrants from Egypt |
| Minimum | 60.5% | 53.2% |
| Maximum | 100.0% | 100.0% |
| Range | 39.5% | 46.8% |
| Mean | 77.7% | 76.6% |
| Median | 77.4% | 75.1% |
| Interquartile 25% (IQ1) | 72.1% | 69.7% |
| Interquartile 75% (IQ3) | 81.6% | 84.1% |
| Interquartile Range (IQR) | 9.5% | 14.4% |
| Standard Deviation (Sample) | 8.7% | 12.5% |
| Standard Deviation (Population) | 8.6% | 12.3% |
Similar Demographics by In Labor Force | Age 20-24
Demographics Similar to Immigrants from Cabo Verde by In Labor Force | Age 20-24
In terms of in labor force | age 20-24, the demographic groups most similar to Immigrants from Cabo Verde are Swedish (78.8%, a difference of 0.070%), Luxembourger (79.0%, a difference of 0.10%), Danish (79.0%, a difference of 0.15%), Aleut (79.0%, a difference of 0.16%), and Slovene (78.7%, a difference of 0.22%).
| Demographics | Rating | Rank | In Labor Force | Age 20-24 |
| Norwegians | 100.0 /100 | #1 | Exceptional 80.1% |
| Immigrants | Somalia | 100.0 /100 | #2 | Exceptional 79.5% |
| Somalis | 100.0 /100 | #3 | Exceptional 79.3% |
| Alaskan Athabascans | 100.0 /100 | #4 | Exceptional 79.1% |
| Aleuts | 100.0 /100 | #5 | Exceptional 79.0% |
| Danes | 100.0 /100 | #6 | Exceptional 79.0% |
| Luxembourgers | 100.0 /100 | #7 | Exceptional 79.0% |
| Immigrants | Cabo Verde | 100.0 /100 | #8 | Exceptional 78.9% |
| Swedes | 100.0 /100 | #9 | Exceptional 78.8% |
| Slovenes | 100.0 /100 | #10 | Exceptional 78.7% |
| Finns | 100.0 /100 | #11 | Exceptional 78.7% |
| Germans | 100.0 /100 | #12 | Exceptional 78.6% |
| Scandinavians | 100.0 /100 | #13 | Exceptional 78.5% |
| Czechs | 100.0 /100 | #14 | Exceptional 78.5% |
| Sudanese | 100.0 /100 | #15 | Exceptional 78.4% |
Demographics Similar to Immigrants from Egypt by In Labor Force | Age 20-24
In terms of in labor force | age 20-24, the demographic groups most similar to Immigrants from Egypt are Black/African American (73.9%, a difference of 0.020%), Immigrants from Belgium (73.9%, a difference of 0.020%), Immigrants from Kazakhstan (73.8%, a difference of 0.020%), Immigrants from Saudi Arabia (73.9%, a difference of 0.070%), and Arapaho (73.8%, a difference of 0.070%).
| Demographics | Rating | Rank | In Labor Force | Age 20-24 |
| Immigrants | South Central Asia | 1.9 /100 | #244 | Tragic 74.0% |
| Turks | 1.8 /100 | #245 | Tragic 73.9% |
| Immigrants | Panama | 1.6 /100 | #246 | Tragic 73.9% |
| Colville | 1.5 /100 | #247 | Tragic 73.9% |
| Immigrants | Saudi Arabia | 1.5 /100 | #248 | Tragic 73.9% |
| Blacks/African Americans | 1.3 /100 | #249 | Tragic 73.9% |
| Immigrants | Belgium | 1.3 /100 | #250 | Tragic 73.9% |
| Immigrants | Egypt | 1.2 /100 | #251 | Tragic 73.8% |
| Immigrants | Kazakhstan | 1.1 /100 | #252 | Tragic 73.8% |
| Arapaho | 1.0 /100 | #253 | Tragic 73.8% |
| Ute | 1.0 /100 | #254 | Tragic 73.8% |
| Immigrants | Pakistan | 0.9 /100 | #255 | Tragic 73.8% |
| Spanish American Indians | 0.8 /100 | #256 | Tragic 73.7% |
| Paraguayans | 0.8 /100 | #257 | Tragic 73.7% |
| Egyptians | 0.7 /100 | #258 | Tragic 73.7% |