Cherokee vs Filipino In Labor Force | Age 20-64
COMPARE
Cherokee
Filipino
In Labor Force | Age 20-64
In Labor Force | Age 20-64 Comparison
Cherokee
Filipinos
76.2%
IN LABOR FORCE | AGE 20-64
0.0/ 100
METRIC RATING
317th/ 347
METRIC RANK
80.1%
IN LABOR FORCE | AGE 20-64
95.6/ 100
METRIC RATING
100th/ 347
METRIC RANK
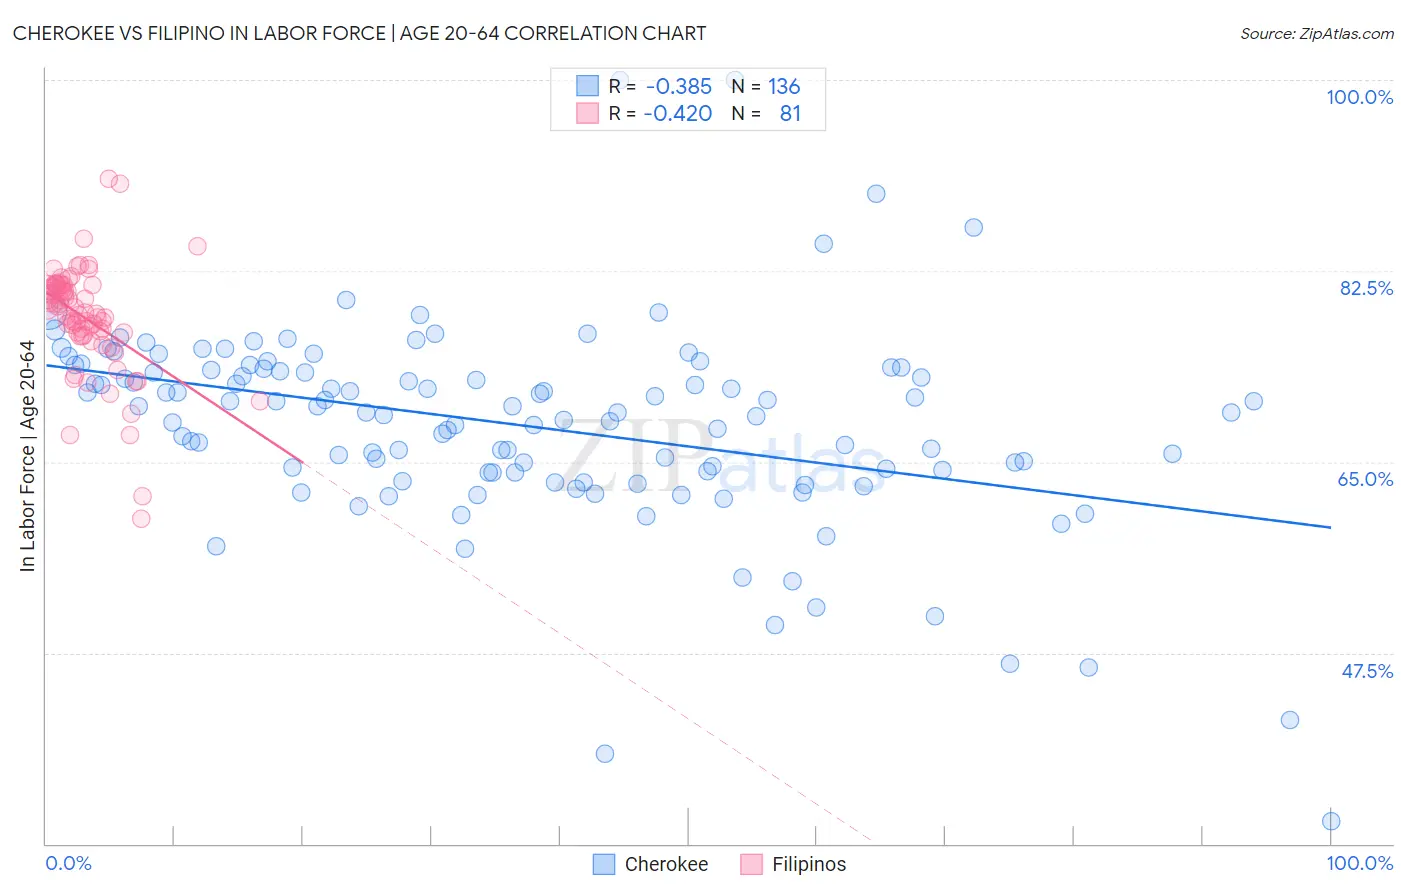
Cherokee vs Filipino In Labor Force | Age 20-64 Correlation Chart
The statistical analysis conducted on geographies consisting of 493,680,494 people shows a mild negative correlation between the proportion of Cherokee and labor force participation rate among population between the ages 20 and 64 in the United States with a correlation coefficient (R) of -0.385 and weighted average of 76.2%. Similarly, the statistical analysis conducted on geographies consisting of 254,357,884 people shows a moderate negative correlation between the proportion of Filipinos and labor force participation rate among population between the ages 20 and 64 in the United States with a correlation coefficient (R) of -0.420 and weighted average of 80.1%, a difference of 5.0%.
In Labor Force | Age 20-64 Correlation Summary
| Measurement | Cherokee | Filipino |
| Minimum | 32.1% | 59.8% |
| Maximum | 100.0% | 90.9% |
| Range | 67.9% | 31.1% |
| Mean | 68.4% | 78.2% |
| Median | 69.6% | 79.1% |
| Interquartile 25% (IQ1) | 64.0% | 76.8% |
| Interquartile 75% (IQ3) | 73.5% | 81.1% |
| Interquartile Range (IQR) | 9.5% | 4.4% |
| Standard Deviation (Sample) | 9.3% | 5.0% |
| Standard Deviation (Population) | 9.3% | 4.9% |
Similar Demographics by In Labor Force | Age 20-64
Demographics Similar to Cherokee by In Labor Force | Age 20-64
In terms of in labor force | age 20-64, the demographic groups most similar to Cherokee are Chickasaw (76.2%, a difference of 0.040%), Inupiat (76.1%, a difference of 0.21%), Yaqui (76.5%, a difference of 0.40%), Ottawa (76.7%, a difference of 0.59%), and Yakama (75.8%, a difference of 0.59%).
| Demographics | Rating | Rank | In Labor Force | Age 20-64 |
| Comanche | 0.0 /100 | #310 | Tragic 77.0% |
| Blackfeet | 0.0 /100 | #311 | Tragic 77.0% |
| Alaskan Athabascans | 0.0 /100 | #312 | Tragic 76.9% |
| Shoshone | 0.0 /100 | #313 | Tragic 76.8% |
| Blacks/African Americans | 0.0 /100 | #314 | Tragic 76.8% |
| Ottawa | 0.0 /100 | #315 | Tragic 76.7% |
| Yaqui | 0.0 /100 | #316 | Tragic 76.5% |
| Cherokee | 0.0 /100 | #317 | Tragic 76.2% |
| Chickasaw | 0.0 /100 | #318 | Tragic 76.2% |
| Inupiat | 0.0 /100 | #319 | Tragic 76.1% |
| Yakama | 0.0 /100 | #320 | Tragic 75.8% |
| Seminole | 0.0 /100 | #321 | Tragic 75.5% |
| Dutch West Indians | 0.0 /100 | #322 | Tragic 75.5% |
| Cajuns | 0.0 /100 | #323 | Tragic 75.5% |
| Choctaw | 0.0 /100 | #324 | Tragic 75.4% |
Demographics Similar to Filipinos by In Labor Force | Age 20-64
In terms of in labor force | age 20-64, the demographic groups most similar to Filipinos are Palestinian (80.0%, a difference of 0.0%), Immigrants from Australia (80.0%, a difference of 0.0%), South American (80.1%, a difference of 0.010%), Immigrants from Uruguay (80.1%, a difference of 0.010%), and Immigrants from Chile (80.1%, a difference of 0.010%).
| Demographics | Rating | Rank | In Labor Force | Age 20-64 |
| Immigrants | Belarus | 96.4 /100 | #93 | Exceptional 80.1% |
| Immigrants | Asia | 96.0 /100 | #94 | Exceptional 80.1% |
| Yugoslavians | 95.9 /100 | #95 | Exceptional 80.1% |
| Immigrants | Malaysia | 95.9 /100 | #96 | Exceptional 80.1% |
| South Americans | 95.9 /100 | #97 | Exceptional 80.1% |
| Immigrants | Uruguay | 95.8 /100 | #98 | Exceptional 80.1% |
| Immigrants | Chile | 95.7 /100 | #99 | Exceptional 80.1% |
| Filipinos | 95.6 /100 | #100 | Exceptional 80.1% |
| Palestinians | 95.5 /100 | #101 | Exceptional 80.0% |
| Immigrants | Australia | 95.5 /100 | #102 | Exceptional 80.0% |
| Russians | 95.5 /100 | #103 | Exceptional 80.0% |
| Venezuelans | 95.3 /100 | #104 | Exceptional 80.0% |
| Immigrants | Ghana | 95.0 /100 | #105 | Exceptional 80.0% |
| Greeks | 94.8 /100 | #106 | Exceptional 80.0% |
| Immigrants | Jordan | 94.8 /100 | #107 | Exceptional 80.0% |