Soviet Union vs Pennsylvania German In Labor Force | Age 16-19
COMPARE
Soviet Union
Pennsylvania German
In Labor Force | Age 16-19
In Labor Force | Age 16-19 Comparison
Soviet Union
Pennsylvania Germans
31.4%
IN LABOR FORCE | AGE 16-19
0.0/ 100
METRIC RATING
319th/ 347
METRIC RANK
46.4%
IN LABOR FORCE | AGE 16-19
100.0/ 100
METRIC RATING
1st/ 347
METRIC RANK
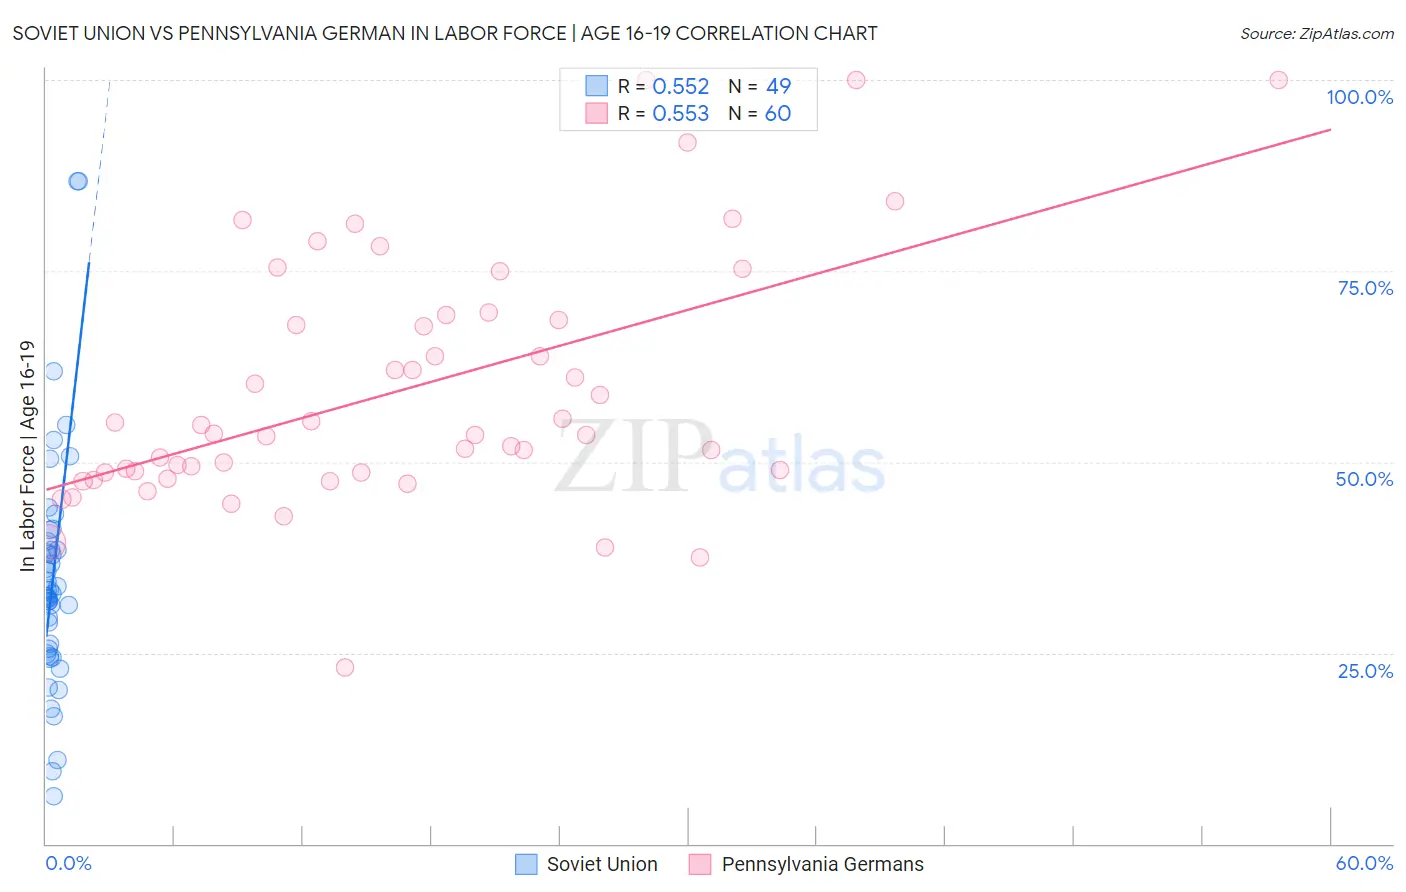
Soviet Union vs Pennsylvania German In Labor Force | Age 16-19 Correlation Chart
The statistical analysis conducted on geographies consisting of 43,506,709 people shows a substantial positive correlation between the proportion of Soviet Union and labor force participation rate among population between the ages 16 and 19 in the United States with a correlation coefficient (R) of 0.552 and weighted average of 31.4%. Similarly, the statistical analysis conducted on geographies consisting of 233,701,573 people shows a substantial positive correlation between the proportion of Pennsylvania Germans and labor force participation rate among population between the ages 16 and 19 in the United States with a correlation coefficient (R) of 0.553 and weighted average of 46.4%, a difference of 47.8%.
In Labor Force | Age 16-19 Correlation Summary
| Measurement | Soviet Union | Pennsylvania German |
| Minimum | 6.3% | 23.1% |
| Maximum | 86.7% | 100.0% |
| Range | 80.4% | 76.9% |
| Mean | 34.8% | 59.4% |
| Median | 32.7% | 53.7% |
| Interquartile 25% (IQ1) | 25.2% | 48.6% |
| Interquartile 75% (IQ3) | 39.1% | 68.9% |
| Interquartile Range (IQR) | 13.9% | 20.3% |
| Standard Deviation (Sample) | 15.5% | 16.4% |
| Standard Deviation (Population) | 15.4% | 16.2% |
Similar Demographics by In Labor Force | Age 16-19
Demographics Similar to Soviet Union by In Labor Force | Age 16-19
In terms of in labor force | age 16-19, the demographic groups most similar to Soviet Union are Ecuadorian (31.4%, a difference of 0.060%), West Indian (31.3%, a difference of 0.30%), Immigrants from Yemen (31.5%, a difference of 0.32%), Tohono O'odham (31.3%, a difference of 0.41%), and Immigrants from Caribbean (31.2%, a difference of 0.54%).
| Demographics | Rating | Rank | In Labor Force | Age 16-19 |
| Immigrants | Belize | 0.0 /100 | #312 | Tragic 31.8% |
| Hopi | 0.0 /100 | #313 | Tragic 31.8% |
| Cubans | 0.0 /100 | #314 | Tragic 31.8% |
| Immigrants | West Indies | 0.0 /100 | #315 | Tragic 31.7% |
| Filipinos | 0.0 /100 | #316 | Tragic 31.7% |
| Immigrants | Nicaragua | 0.0 /100 | #317 | Tragic 31.6% |
| Immigrants | Yemen | 0.0 /100 | #318 | Tragic 31.5% |
| Soviet Union | 0.0 /100 | #319 | Tragic 31.4% |
| Ecuadorians | 0.0 /100 | #320 | Tragic 31.4% |
| West Indians | 0.0 /100 | #321 | Tragic 31.3% |
| Tohono O'odham | 0.0 /100 | #322 | Tragic 31.3% |
| Immigrants | Caribbean | 0.0 /100 | #323 | Tragic 31.2% |
| Dominicans | 0.0 /100 | #324 | Tragic 31.2% |
| Immigrants | China | 0.0 /100 | #325 | Tragic 31.1% |
| Immigrants | Dominican Republic | 0.0 /100 | #326 | Tragic 31.1% |
Demographics Similar to Pennsylvania Germans by In Labor Force | Age 16-19
In terms of in labor force | age 16-19, the demographic groups most similar to Pennsylvania Germans are Norwegian (46.2%, a difference of 0.56%), Immigrants from Somalia (45.6%, a difference of 1.9%), Luxembourger (45.3%, a difference of 2.5%), Alaskan Athabascan (45.2%, a difference of 2.7%), and Somali (45.1%, a difference of 2.9%).
| Demographics | Rating | Rank | In Labor Force | Age 16-19 |
| Pennsylvania Germans | 100.0 /100 | #1 | Exceptional 46.4% |
| Norwegians | 100.0 /100 | #2 | Exceptional 46.2% |
| Immigrants | Somalia | 100.0 /100 | #3 | Exceptional 45.6% |
| Luxembourgers | 100.0 /100 | #4 | Exceptional 45.3% |
| Alaskan Athabascans | 100.0 /100 | #5 | Exceptional 45.2% |
| Somalis | 100.0 /100 | #6 | Exceptional 45.1% |
| Danes | 100.0 /100 | #7 | Exceptional 44.7% |
| Immigrants | Cabo Verde | 100.0 /100 | #8 | Exceptional 44.7% |
| Cape Verdeans | 100.0 /100 | #9 | Exceptional 44.5% |
| Germans | 100.0 /100 | #10 | Exceptional 44.2% |
| Swedes | 100.0 /100 | #11 | Exceptional 44.1% |
| Finns | 100.0 /100 | #12 | Exceptional 43.9% |
| Dutch | 100.0 /100 | #13 | Exceptional 43.8% |
| Chippewa | 100.0 /100 | #14 | Exceptional 43.8% |
| Slovenes | 100.0 /100 | #15 | Exceptional 43.7% |