Immigrants from Zimbabwe vs Bahamian In Labor Force | Age 30-34
COMPARE
Immigrants from Zimbabwe
Bahamian
In Labor Force | Age 30-34
In Labor Force | Age 30-34 Comparison
Immigrants from Zimbabwe
Bahamians
85.1%
IN LABOR FORCE | AGE 30-34
95.8/ 100
METRIC RATING
108th/ 347
METRIC RANK
83.9%
IN LABOR FORCE | AGE 30-34
0.6/ 100
METRIC RATING
252nd/ 347
METRIC RANK
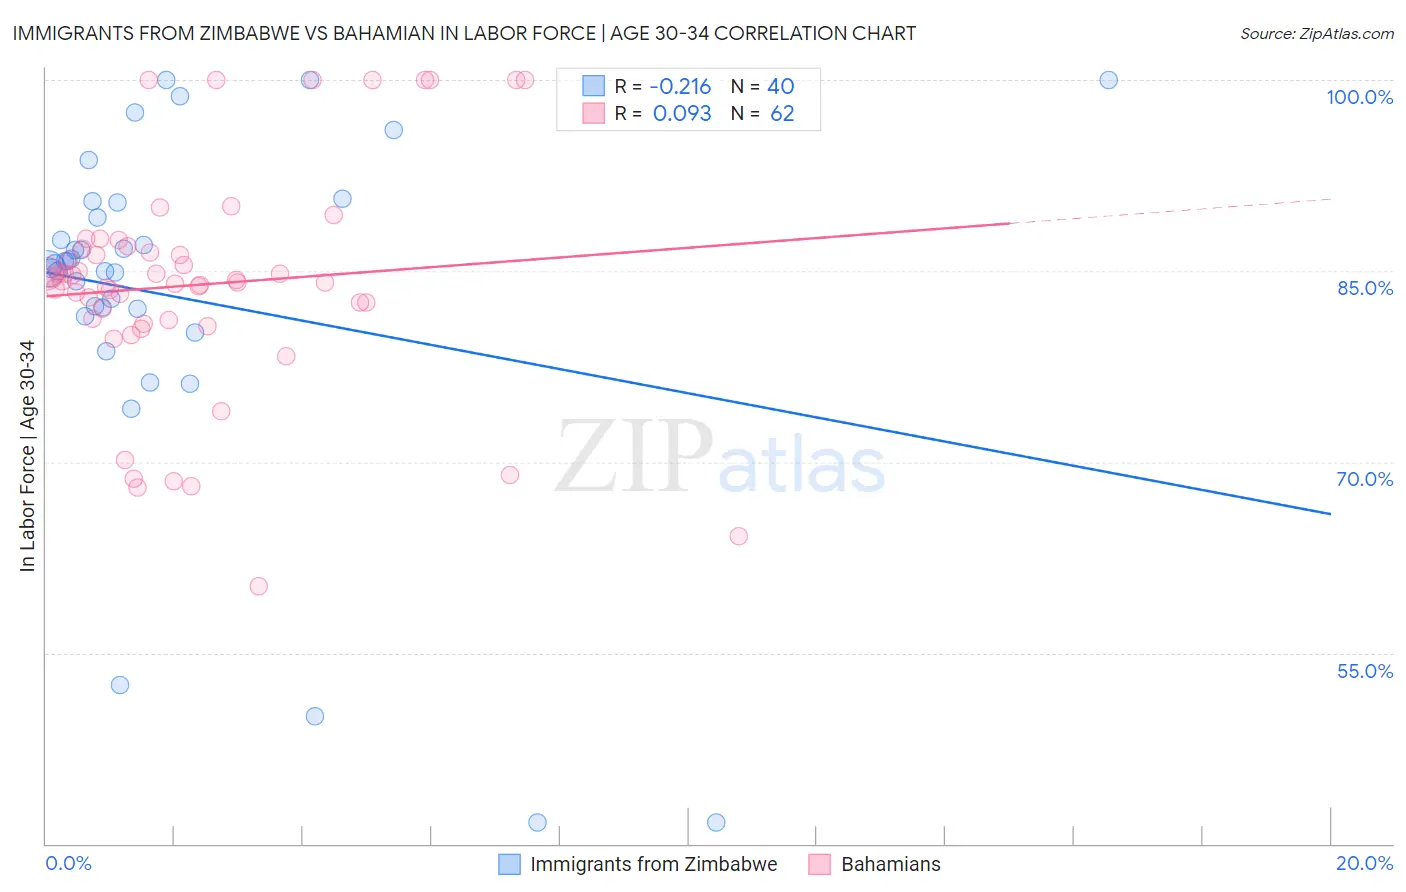
Immigrants from Zimbabwe vs Bahamian In Labor Force | Age 30-34 Correlation Chart
The statistical analysis conducted on geographies consisting of 117,799,527 people shows a weak negative correlation between the proportion of Immigrants from Zimbabwe and labor force participation rate among population between the ages 30 and 34 in the United States with a correlation coefficient (R) of -0.216 and weighted average of 85.1%. Similarly, the statistical analysis conducted on geographies consisting of 112,639,396 people shows a slight positive correlation between the proportion of Bahamians and labor force participation rate among population between the ages 30 and 34 in the United States with a correlation coefficient (R) of 0.093 and weighted average of 83.9%, a difference of 1.5%.
In Labor Force | Age 30-34 Correlation Summary
| Measurement | Immigrants from Zimbabwe | Bahamian |
| Minimum | 41.7% | 60.2% |
| Maximum | 100.0% | 100.0% |
| Range | 58.3% | 39.8% |
| Mean | 82.9% | 83.9% |
| Median | 85.4% | 84.2% |
| Interquartile 25% (IQ1) | 81.8% | 81.2% |
| Interquartile 75% (IQ3) | 89.8% | 86.7% |
| Interquartile Range (IQR) | 8.0% | 5.5% |
| Standard Deviation (Sample) | 13.9% | 8.9% |
| Standard Deviation (Population) | 13.8% | 8.8% |
Similar Demographics by In Labor Force | Age 30-34
Demographics Similar to Immigrants from Zimbabwe by In Labor Force | Age 30-34
In terms of in labor force | age 30-34, the demographic groups most similar to Immigrants from Zimbabwe are Argentinean (85.1%, a difference of 0.0%), Immigrants from Northern Africa (85.2%, a difference of 0.020%), Immigrants from South Africa (85.1%, a difference of 0.020%), Alsatian (85.2%, a difference of 0.030%), and Immigrants from Middle Africa (85.2%, a difference of 0.030%).
| Demographics | Rating | Rank | In Labor Force | Age 30-34 |
| Immigrants | Belarus | 96.9 /100 | #101 | Exceptional 85.2% |
| Immigrants | Austria | 96.8 /100 | #102 | Exceptional 85.2% |
| Ukrainians | 96.6 /100 | #103 | Exceptional 85.2% |
| Immigrants | Ghana | 96.5 /100 | #104 | Exceptional 85.2% |
| Alsatians | 96.3 /100 | #105 | Exceptional 85.2% |
| Immigrants | Middle Africa | 96.3 /100 | #106 | Exceptional 85.2% |
| Immigrants | Northern Africa | 96.3 /100 | #107 | Exceptional 85.2% |
| Immigrants | Zimbabwe | 95.8 /100 | #108 | Exceptional 85.1% |
| Argentineans | 95.8 /100 | #109 | Exceptional 85.1% |
| Immigrants | South Africa | 95.3 /100 | #110 | Exceptional 85.1% |
| Immigrants | Scotland | 94.9 /100 | #111 | Exceptional 85.1% |
| Immigrants | Hungary | 94.8 /100 | #112 | Exceptional 85.1% |
| Immigrants | Romania | 94.7 /100 | #113 | Exceptional 85.1% |
| Yugoslavians | 94.7 /100 | #114 | Exceptional 85.1% |
| Immigrants | South Central Asia | 94.6 /100 | #115 | Exceptional 85.1% |
Demographics Similar to Bahamians by In Labor Force | Age 30-34
In terms of in labor force | age 30-34, the demographic groups most similar to Bahamians are Nicaraguan (83.9%, a difference of 0.0%), Immigrants from Nicaragua (83.9%, a difference of 0.0%), Immigrants from Iraq (83.9%, a difference of 0.020%), Immigrants from St. Vincent and the Grenadines (83.9%, a difference of 0.020%), and Portuguese (84.0%, a difference of 0.040%).
| Demographics | Rating | Rank | In Labor Force | Age 30-34 |
| Immigrants | Venezuela | 0.9 /100 | #245 | Tragic 84.0% |
| Central Americans | 0.9 /100 | #246 | Tragic 84.0% |
| British West Indians | 0.8 /100 | #247 | Tragic 84.0% |
| Portuguese | 0.8 /100 | #248 | Tragic 84.0% |
| Immigrants | Dominica | 0.7 /100 | #249 | Tragic 84.0% |
| Immigrants | Iraq | 0.7 /100 | #250 | Tragic 83.9% |
| Nicaraguans | 0.6 /100 | #251 | Tragic 83.9% |
| Bahamians | 0.6 /100 | #252 | Tragic 83.9% |
| Immigrants | Nicaragua | 0.6 /100 | #253 | Tragic 83.9% |
| Immigrants | St. Vincent and the Grenadines | 0.5 /100 | #254 | Tragic 83.9% |
| Whites/Caucasians | 0.5 /100 | #255 | Tragic 83.9% |
| Immigrants | Lebanon | 0.4 /100 | #256 | Tragic 83.9% |
| Iraqis | 0.3 /100 | #257 | Tragic 83.8% |
| Hondurans | 0.3 /100 | #258 | Tragic 83.8% |
| Scotch-Irish | 0.3 /100 | #259 | Tragic 83.8% |