Immigrants from Eastern Africa vs Bahamian In Labor Force | Age 30-34
COMPARE
Immigrants from Eastern Africa
Bahamian
In Labor Force | Age 30-34
In Labor Force | Age 30-34 Comparison
Immigrants from Eastern Africa
Bahamians
85.9%
IN LABOR FORCE | AGE 30-34
100.0/ 100
METRIC RATING
26th/ 347
METRIC RANK
83.9%
IN LABOR FORCE | AGE 30-34
0.6/ 100
METRIC RATING
252nd/ 347
METRIC RANK
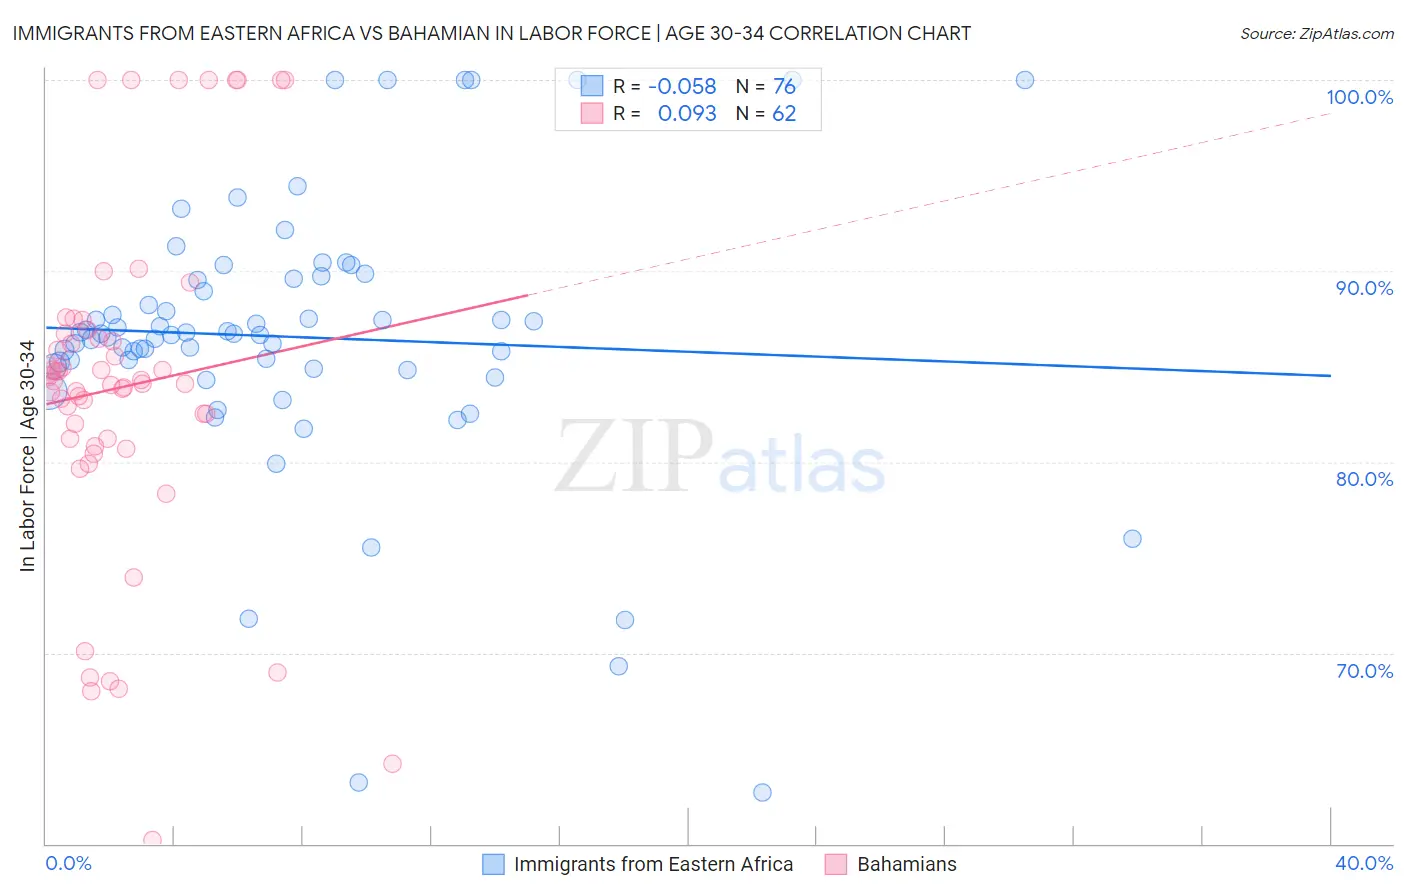
Immigrants from Eastern Africa vs Bahamian In Labor Force | Age 30-34 Correlation Chart
The statistical analysis conducted on geographies consisting of 354,960,514 people shows a slight negative correlation between the proportion of Immigrants from Eastern Africa and labor force participation rate among population between the ages 30 and 34 in the United States with a correlation coefficient (R) of -0.058 and weighted average of 85.9%. Similarly, the statistical analysis conducted on geographies consisting of 112,639,396 people shows a slight positive correlation between the proportion of Bahamians and labor force participation rate among population between the ages 30 and 34 in the United States with a correlation coefficient (R) of 0.093 and weighted average of 83.9%, a difference of 2.4%.
In Labor Force | Age 30-34 Correlation Summary
| Measurement | Immigrants from Eastern Africa | Bahamian |
| Minimum | 62.7% | 60.2% |
| Maximum | 100.0% | 100.0% |
| Range | 37.3% | 39.8% |
| Mean | 86.5% | 83.9% |
| Median | 86.7% | 84.2% |
| Interquartile 25% (IQ1) | 84.9% | 81.2% |
| Interquartile 75% (IQ3) | 89.6% | 86.7% |
| Interquartile Range (IQR) | 4.6% | 5.5% |
| Standard Deviation (Sample) | 7.2% | 8.9% |
| Standard Deviation (Population) | 7.1% | 8.8% |
Similar Demographics by In Labor Force | Age 30-34
Demographics Similar to Immigrants from Eastern Africa by In Labor Force | Age 30-34
In terms of in labor force | age 30-34, the demographic groups most similar to Immigrants from Eastern Africa are Immigrants from North Macedonia (85.9%, a difference of 0.010%), Immigrants from Eritrea (85.9%, a difference of 0.020%), Immigrants from Liberia (85.9%, a difference of 0.020%), Bermudan (85.9%, a difference of 0.030%), and Estonian (85.9%, a difference of 0.030%).
| Demographics | Rating | Rank | In Labor Force | Age 30-34 |
| Sierra Leoneans | 100.0 /100 | #19 | Exceptional 86.0% |
| Bulgarians | 100.0 /100 | #20 | Exceptional 86.0% |
| Immigrants | Bulgaria | 100.0 /100 | #21 | Exceptional 86.0% |
| Bermudans | 100.0 /100 | #22 | Exceptional 85.9% |
| Estonians | 100.0 /100 | #23 | Exceptional 85.9% |
| Immigrants | Eritrea | 100.0 /100 | #24 | Exceptional 85.9% |
| Immigrants | North Macedonia | 100.0 /100 | #25 | Exceptional 85.9% |
| Immigrants | Eastern Africa | 100.0 /100 | #26 | Exceptional 85.9% |
| Immigrants | Liberia | 100.0 /100 | #27 | Exceptional 85.9% |
| Immigrants | Latvia | 100.0 /100 | #28 | Exceptional 85.9% |
| Tsimshian | 100.0 /100 | #29 | Exceptional 85.8% |
| Immigrants | Hong Kong | 100.0 /100 | #30 | Exceptional 85.8% |
| Paraguayans | 99.9 /100 | #31 | Exceptional 85.8% |
| Cypriots | 99.9 /100 | #32 | Exceptional 85.8% |
| Immigrants | Bosnia and Herzegovina | 99.9 /100 | #33 | Exceptional 85.8% |
Demographics Similar to Bahamians by In Labor Force | Age 30-34
In terms of in labor force | age 30-34, the demographic groups most similar to Bahamians are Nicaraguan (83.9%, a difference of 0.0%), Immigrants from Nicaragua (83.9%, a difference of 0.0%), Immigrants from Iraq (83.9%, a difference of 0.020%), Immigrants from St. Vincent and the Grenadines (83.9%, a difference of 0.020%), and Portuguese (84.0%, a difference of 0.040%).
| Demographics | Rating | Rank | In Labor Force | Age 30-34 |
| Immigrants | Venezuela | 0.9 /100 | #245 | Tragic 84.0% |
| Central Americans | 0.9 /100 | #246 | Tragic 84.0% |
| British West Indians | 0.8 /100 | #247 | Tragic 84.0% |
| Portuguese | 0.8 /100 | #248 | Tragic 84.0% |
| Immigrants | Dominica | 0.7 /100 | #249 | Tragic 84.0% |
| Immigrants | Iraq | 0.7 /100 | #250 | Tragic 83.9% |
| Nicaraguans | 0.6 /100 | #251 | Tragic 83.9% |
| Bahamians | 0.6 /100 | #252 | Tragic 83.9% |
| Immigrants | Nicaragua | 0.6 /100 | #253 | Tragic 83.9% |
| Immigrants | St. Vincent and the Grenadines | 0.5 /100 | #254 | Tragic 83.9% |
| Whites/Caucasians | 0.5 /100 | #255 | Tragic 83.9% |
| Immigrants | Lebanon | 0.4 /100 | #256 | Tragic 83.9% |
| Iraqis | 0.3 /100 | #257 | Tragic 83.8% |
| Hondurans | 0.3 /100 | #258 | Tragic 83.8% |
| Scotch-Irish | 0.3 /100 | #259 | Tragic 83.8% |