Immigrants from Switzerland vs West Indian In Labor Force | Age 20-24
COMPARE
Immigrants from Switzerland
West Indian
In Labor Force | Age 20-24
In Labor Force | Age 20-24 Comparison
Immigrants from Switzerland
West Indians
74.2%
IN LABOR FORCE | AGE 20-24
4.1/ 100
METRIC RATING
232nd/ 347
METRIC RANK
71.3%
IN LABOR FORCE | AGE 20-24
0.0/ 100
METRIC RATING
323rd/ 347
METRIC RANK
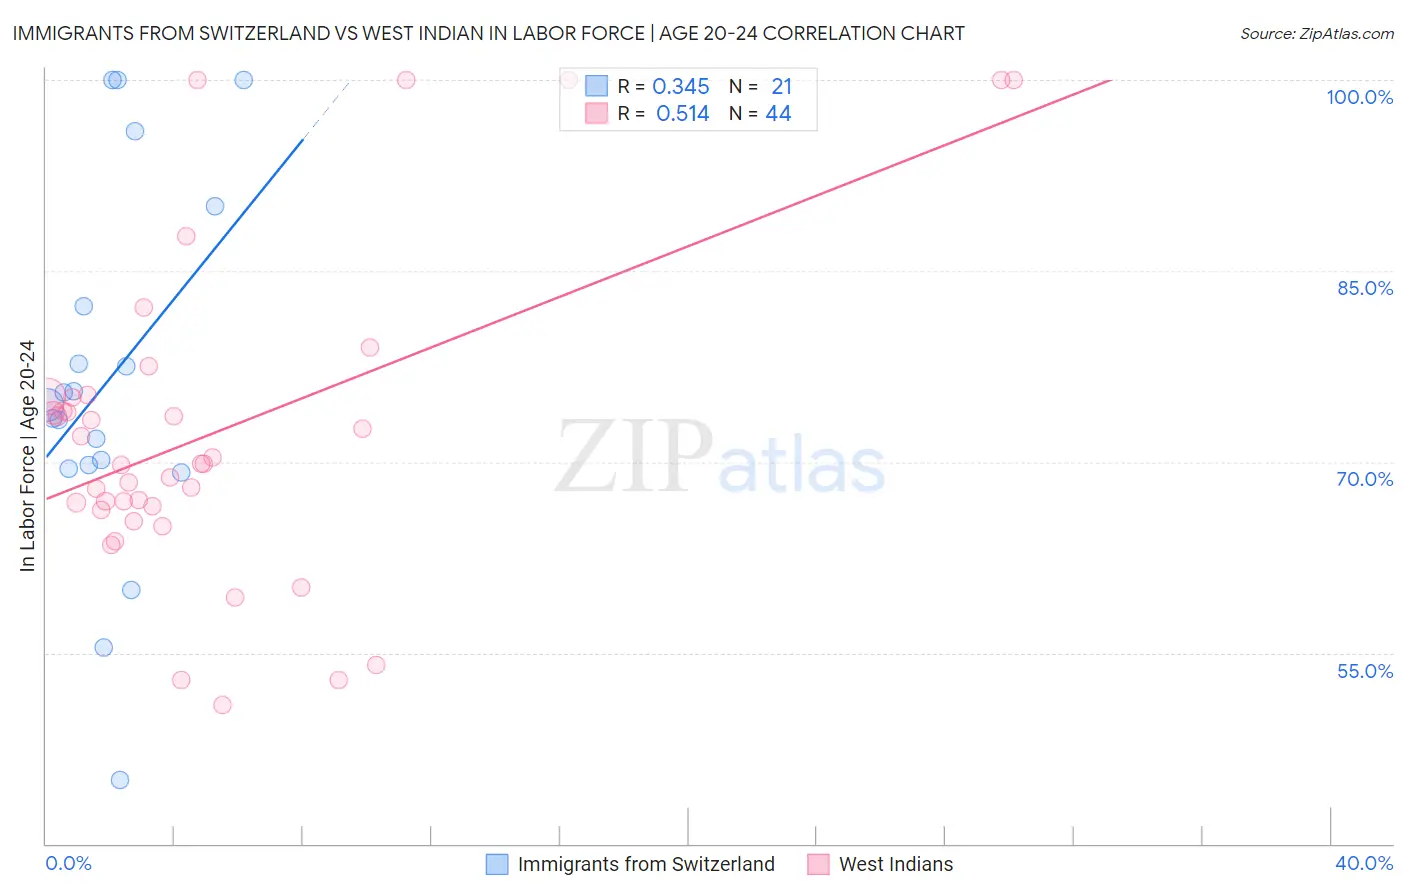
Immigrants from Switzerland vs West Indian In Labor Force | Age 20-24 Correlation Chart
The statistical analysis conducted on geographies consisting of 148,049,599 people shows a mild positive correlation between the proportion of Immigrants from Switzerland and labor force participation rate among population between the ages 20 and 24 in the United States with a correlation coefficient (R) of 0.345 and weighted average of 74.2%. Similarly, the statistical analysis conducted on geographies consisting of 254,022,866 people shows a substantial positive correlation between the proportion of West Indians and labor force participation rate among population between the ages 20 and 24 in the United States with a correlation coefficient (R) of 0.514 and weighted average of 71.3%, a difference of 4.1%.
In Labor Force | Age 20-24 Correlation Summary
| Measurement | Immigrants from Switzerland | West Indian |
| Minimum | 45.0% | 50.9% |
| Maximum | 100.0% | 100.0% |
| Range | 55.0% | 49.1% |
| Mean | 76.5% | 72.3% |
| Median | 74.4% | 69.9% |
| Interquartile 25% (IQ1) | 69.6% | 66.3% |
| Interquartile 75% (IQ3) | 86.1% | 75.1% |
| Interquartile Range (IQR) | 16.5% | 8.7% |
| Standard Deviation (Sample) | 14.5% | 12.5% |
| Standard Deviation (Population) | 14.1% | 12.3% |
Similar Demographics by In Labor Force | Age 20-24
Demographics Similar to Immigrants from Switzerland by In Labor Force | Age 20-24
In terms of in labor force | age 20-24, the demographic groups most similar to Immigrants from Switzerland are Immigrants from Greece (74.2%, a difference of 0.010%), Immigrants from Albania (74.2%, a difference of 0.020%), Immigrants from Chile (74.1%, a difference of 0.040%), Immigrants from Sweden (74.2%, a difference of 0.050%), and Immigrants (74.1%, a difference of 0.050%).
| Demographics | Rating | Rank | In Labor Force | Age 20-24 |
| Ghanaians | 6.2 /100 | #225 | Tragic 74.3% |
| Immigrants | Fiji | 5.9 /100 | #226 | Tragic 74.3% |
| Immigrants | Ireland | 5.8 /100 | #227 | Tragic 74.3% |
| Immigrants | Ukraine | 5.1 /100 | #228 | Tragic 74.2% |
| Immigrants | Sweden | 4.6 /100 | #229 | Tragic 74.2% |
| Immigrants | Albania | 4.3 /100 | #230 | Tragic 74.2% |
| Immigrants | Greece | 4.1 /100 | #231 | Tragic 74.2% |
| Immigrants | Switzerland | 4.1 /100 | #232 | Tragic 74.2% |
| Immigrants | Chile | 3.7 /100 | #233 | Tragic 74.1% |
| Immigrants | Immigrants | 3.6 /100 | #234 | Tragic 74.1% |
| Laotians | 3.5 /100 | #235 | Tragic 74.1% |
| Immigrants | France | 3.3 /100 | #236 | Tragic 74.1% |
| Bermudans | 3.2 /100 | #237 | Tragic 74.1% |
| Immigrants | Japan | 3.0 /100 | #238 | Tragic 74.1% |
| Immigrants | Latin America | 2.7 /100 | #239 | Tragic 74.1% |
Demographics Similar to West Indians by In Labor Force | Age 20-24
In terms of in labor force | age 20-24, the demographic groups most similar to West Indians are Immigrants from Dominican Republic (71.2%, a difference of 0.090%), Filipino (71.4%, a difference of 0.18%), Barbadian (71.1%, a difference of 0.20%), Dominican (71.1%, a difference of 0.28%), and Immigrants from Trinidad and Tobago (71.1%, a difference of 0.28%).
| Demographics | Rating | Rank | In Labor Force | Age 20-24 |
| Immigrants | Eastern Asia | 0.0 /100 | #316 | Tragic 71.8% |
| Immigrants | Armenia | 0.0 /100 | #317 | Tragic 71.7% |
| Immigrants | Hong Kong | 0.0 /100 | #318 | Tragic 71.6% |
| Immigrants | Israel | 0.0 /100 | #319 | Tragic 71.6% |
| Trinidadians and Tobagonians | 0.0 /100 | #320 | Tragic 71.5% |
| Immigrants | Taiwan | 0.0 /100 | #321 | Tragic 71.5% |
| Filipinos | 0.0 /100 | #322 | Tragic 71.4% |
| West Indians | 0.0 /100 | #323 | Tragic 71.3% |
| Immigrants | Dominican Republic | 0.0 /100 | #324 | Tragic 71.2% |
| Barbadians | 0.0 /100 | #325 | Tragic 71.1% |
| Dominicans | 0.0 /100 | #326 | Tragic 71.1% |
| Immigrants | Trinidad and Tobago | 0.0 /100 | #327 | Tragic 71.1% |
| Immigrants | China | 0.0 /100 | #328 | Tragic 71.1% |
| Yup'ik | 0.0 /100 | #329 | Tragic 70.9% |
| Vietnamese | 0.0 /100 | #330 | Tragic 70.6% |