Immigrants from North America vs Tsimshian In Labor Force | Age 16-19
COMPARE
Immigrants from North America
Tsimshian
In Labor Force | Age 16-19
In Labor Force | Age 16-19 Comparison
Immigrants from North America
Tsimshian
38.9%
IN LABOR FORCE | AGE 16-19
99.4/ 100
METRIC RATING
95th/ 347
METRIC RANK
37.4%
IN LABOR FORCE | AGE 16-19
84.7/ 100
METRIC RATING
150th/ 347
METRIC RANK
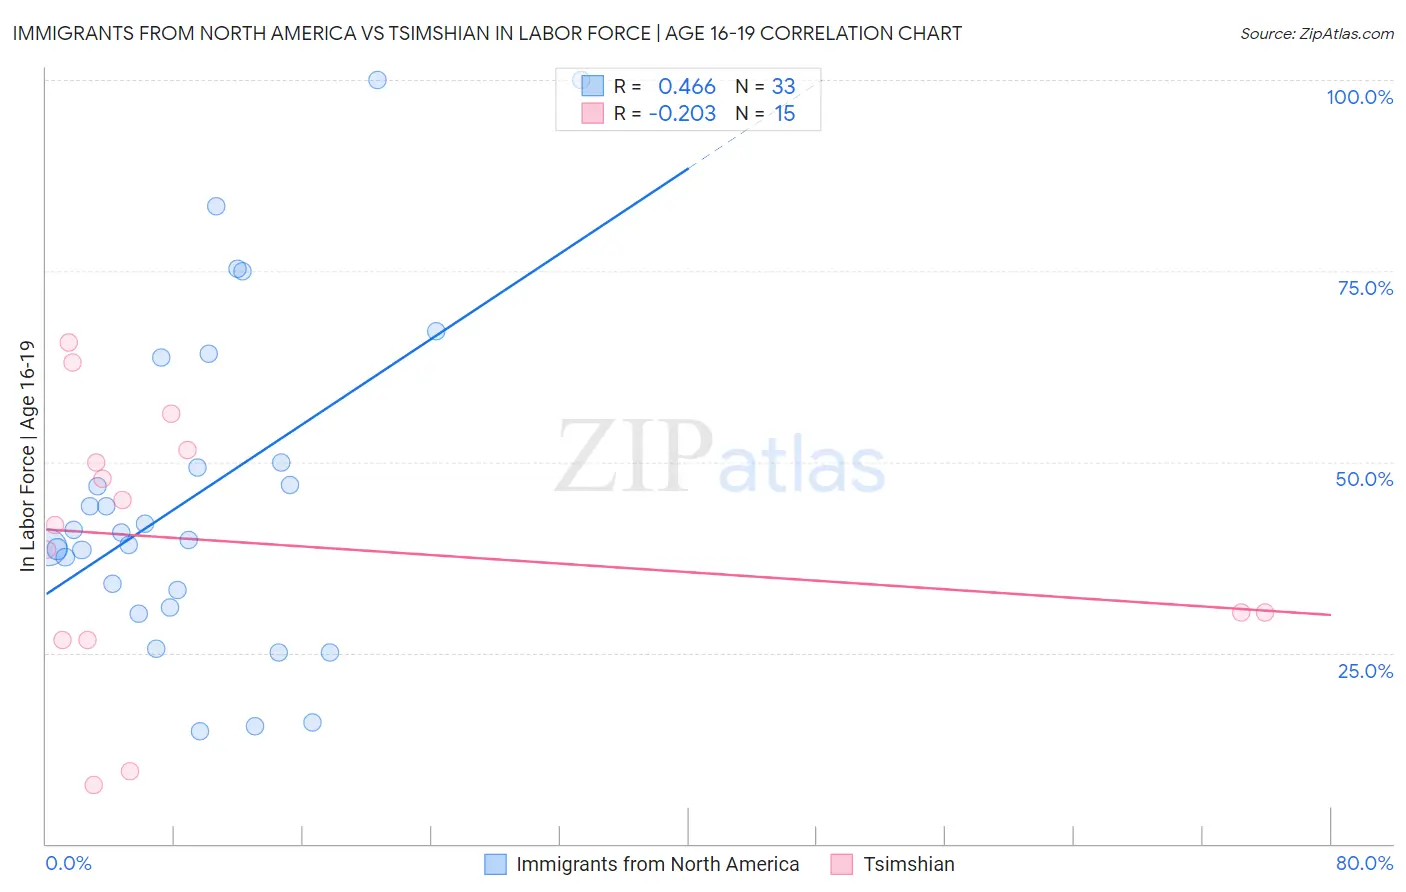
Immigrants from North America vs Tsimshian In Labor Force | Age 16-19 Correlation Chart
The statistical analysis conducted on geographies consisting of 461,140,424 people shows a moderate positive correlation between the proportion of Immigrants from North America and labor force participation rate among population between the ages 16 and 19 in the United States with a correlation coefficient (R) of 0.466 and weighted average of 38.9%. Similarly, the statistical analysis conducted on geographies consisting of 15,624,472 people shows a weak negative correlation between the proportion of Tsimshian and labor force participation rate among population between the ages 16 and 19 in the United States with a correlation coefficient (R) of -0.203 and weighted average of 37.4%, a difference of 4.1%.
In Labor Force | Age 16-19 Correlation Summary
| Measurement | Immigrants from North America | Tsimshian |
| Minimum | 14.7% | 7.7% |
| Maximum | 100.0% | 65.7% |
| Range | 85.3% | 58.0% |
| Mean | 45.9% | 39.4% |
| Median | 40.7% | 41.8% |
| Interquartile 25% (IQ1) | 32.1% | 26.6% |
| Interquartile 75% (IQ3) | 56.8% | 51.5% |
| Interquartile Range (IQR) | 24.7% | 24.9% |
| Standard Deviation (Sample) | 21.9% | 17.5% |
| Standard Deviation (Population) | 21.6% | 16.9% |
Similar Demographics by In Labor Force | Age 16-19
Demographics Similar to Immigrants from North America by In Labor Force | Age 16-19
In terms of in labor force | age 16-19, the demographic groups most similar to Immigrants from North America are Latvian (38.9%, a difference of 0.030%), Greek (38.9%, a difference of 0.070%), Ugandan (38.9%, a difference of 0.080%), Blackfeet (38.9%, a difference of 0.090%), and Immigrants from Canada (38.9%, a difference of 0.090%).
| Demographics | Rating | Rank | In Labor Force | Age 16-19 |
| Puget Sound Salish | 99.6 /100 | #88 | Exceptional 39.1% |
| Alaska Natives | 99.6 /100 | #89 | Exceptional 39.1% |
| Immigrants | Burma/Myanmar | 99.5 /100 | #90 | Exceptional 39.0% |
| Spanish Americans | 99.5 /100 | #91 | Exceptional 39.0% |
| Osage | 99.4 /100 | #92 | Exceptional 39.0% |
| Blackfeet | 99.4 /100 | #93 | Exceptional 38.9% |
| Immigrants | Canada | 99.4 /100 | #94 | Exceptional 38.9% |
| Immigrants | North America | 99.4 /100 | #95 | Exceptional 38.9% |
| Latvians | 99.4 /100 | #96 | Exceptional 38.9% |
| Greeks | 99.3 /100 | #97 | Exceptional 38.9% |
| Ugandans | 99.3 /100 | #98 | Exceptional 38.9% |
| Immigrants | North Macedonia | 99.3 /100 | #99 | Exceptional 38.9% |
| Immigrants | Thailand | 99.1 /100 | #100 | Exceptional 38.7% |
| Hmong | 99.1 /100 | #101 | Exceptional 38.7% |
| Zimbabweans | 99.1 /100 | #102 | Exceptional 38.7% |
Demographics Similar to Tsimshian by In Labor Force | Age 16-19
In terms of in labor force | age 16-19, the demographic groups most similar to Tsimshian are Native Hawaiian (37.4%, a difference of 0.030%), Immigrants from Poland (37.3%, a difference of 0.030%), Immigrants from Sierra Leone (37.3%, a difference of 0.10%), Arapaho (37.3%, a difference of 0.25%), and Romanian (37.5%, a difference of 0.26%).
| Demographics | Rating | Rank | In Labor Force | Age 16-19 |
| Pakistanis | 89.5 /100 | #143 | Excellent 37.6% |
| Japanese | 89.3 /100 | #144 | Excellent 37.5% |
| Paiute | 89.3 /100 | #145 | Excellent 37.5% |
| Immigrants | Western Europe | 88.9 /100 | #146 | Excellent 37.5% |
| Brazilians | 88.7 /100 | #147 | Excellent 37.5% |
| Romanians | 87.3 /100 | #148 | Excellent 37.5% |
| Native Hawaiians | 85.0 /100 | #149 | Excellent 37.4% |
| Tsimshian | 84.7 /100 | #150 | Excellent 37.4% |
| Immigrants | Poland | 84.4 /100 | #151 | Excellent 37.3% |
| Immigrants | Sierra Leone | 83.6 /100 | #152 | Excellent 37.3% |
| Arapaho | 81.8 /100 | #153 | Excellent 37.3% |
| Immigrants | Bulgaria | 81.6 /100 | #154 | Excellent 37.3% |
| Immigrants | Lithuania | 80.7 /100 | #155 | Excellent 37.2% |
| Kiowa | 80.4 /100 | #156 | Excellent 37.2% |
| Immigrants | Brazil | 76.5 /100 | #157 | Good 37.1% |