Immigrants from Bosnia and Herzegovina vs Tsimshian In Labor Force | Age 16-19
COMPARE
Immigrants from Bosnia and Herzegovina
Tsimshian
In Labor Force | Age 16-19
In Labor Force | Age 16-19 Comparison
Immigrants from Bosnia and Herzegovina
Tsimshian
41.8%
IN LABOR FORCE | AGE 16-19
100.0/ 100
METRIC RATING
34th/ 347
METRIC RANK
37.4%
IN LABOR FORCE | AGE 16-19
84.7/ 100
METRIC RATING
150th/ 347
METRIC RANK
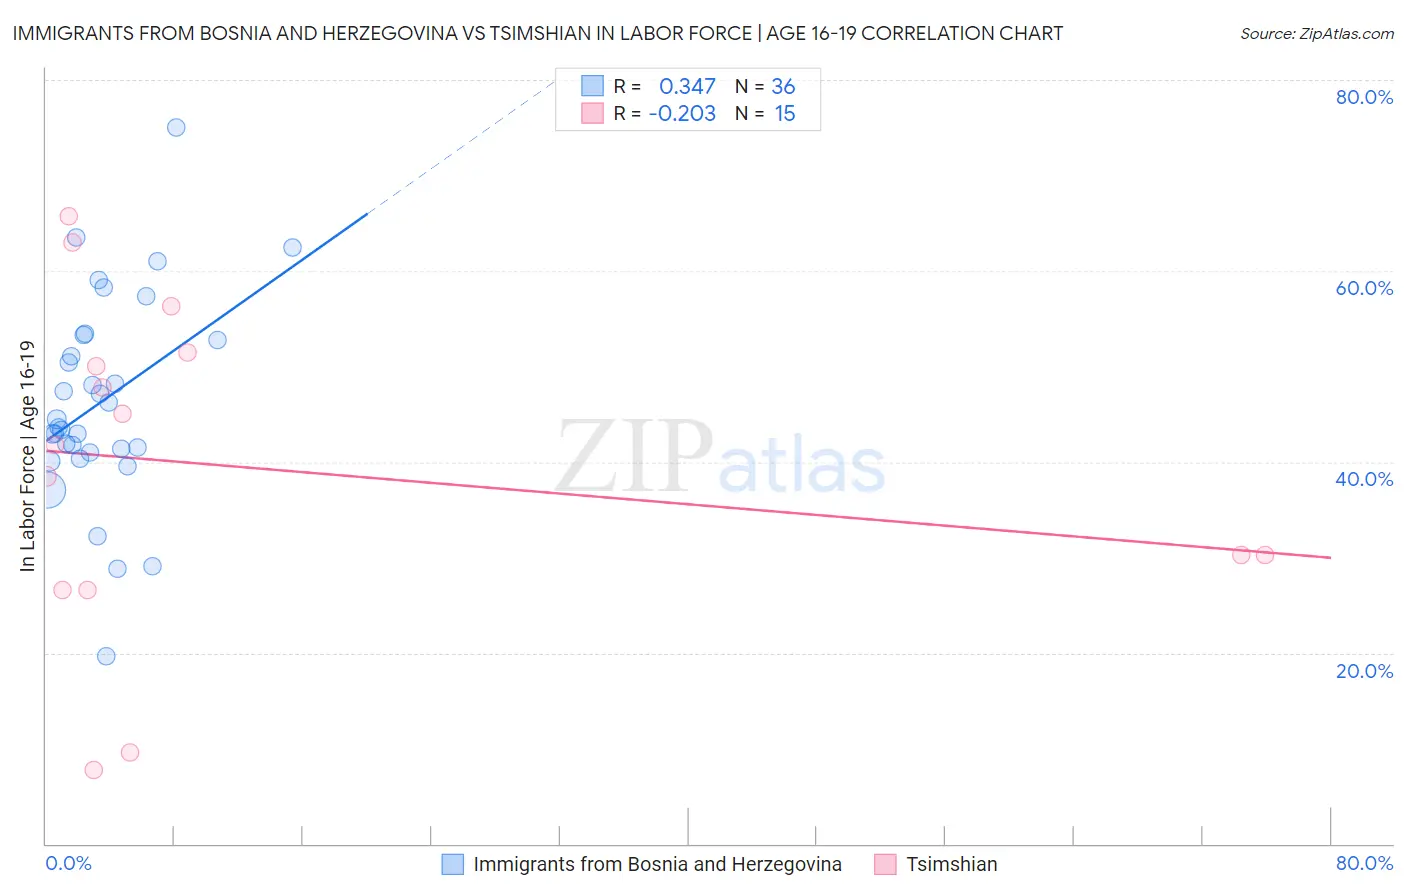
Immigrants from Bosnia and Herzegovina vs Tsimshian In Labor Force | Age 16-19 Correlation Chart
The statistical analysis conducted on geographies consisting of 156,804,758 people shows a mild positive correlation between the proportion of Immigrants from Bosnia and Herzegovina and labor force participation rate among population between the ages 16 and 19 in the United States with a correlation coefficient (R) of 0.347 and weighted average of 41.8%. Similarly, the statistical analysis conducted on geographies consisting of 15,624,472 people shows a weak negative correlation between the proportion of Tsimshian and labor force participation rate among population between the ages 16 and 19 in the United States with a correlation coefficient (R) of -0.203 and weighted average of 37.4%, a difference of 11.9%.
In Labor Force | Age 16-19 Correlation Summary
| Measurement | Immigrants from Bosnia and Herzegovina | Tsimshian |
| Minimum | 19.7% | 7.7% |
| Maximum | 75.0% | 65.7% |
| Range | 55.3% | 58.0% |
| Mean | 46.4% | 39.4% |
| Median | 44.0% | 41.8% |
| Interquartile 25% (IQ1) | 41.2% | 26.6% |
| Interquartile 75% (IQ3) | 53.0% | 51.5% |
| Interquartile Range (IQR) | 11.9% | 24.9% |
| Standard Deviation (Sample) | 10.8% | 17.5% |
| Standard Deviation (Population) | 10.7% | 16.9% |
Similar Demographics by In Labor Force | Age 16-19
Demographics Similar to Immigrants from Bosnia and Herzegovina by In Labor Force | Age 16-19
In terms of in labor force | age 16-19, the demographic groups most similar to Immigrants from Bosnia and Herzegovina are Yugoslavian (41.8%, a difference of 0.020%), Liberian (41.8%, a difference of 0.080%), Immigrants from the Azores (41.7%, a difference of 0.16%), Czechoslovakian (41.9%, a difference of 0.22%), and Immigrants from Congo (41.7%, a difference of 0.24%).
| Demographics | Rating | Rank | In Labor Force | Age 16-19 |
| Welsh | 100.0 /100 | #27 | Exceptional 42.3% |
| Poles | 100.0 /100 | #28 | Exceptional 42.1% |
| French | 100.0 /100 | #29 | Exceptional 42.1% |
| Scottish | 100.0 /100 | #30 | Exceptional 42.0% |
| Irish | 100.0 /100 | #31 | Exceptional 42.0% |
| Czechoslovakians | 100.0 /100 | #32 | Exceptional 41.9% |
| Liberians | 100.0 /100 | #33 | Exceptional 41.8% |
| Immigrants | Bosnia and Herzegovina | 100.0 /100 | #34 | Exceptional 41.8% |
| Yugoslavians | 100.0 /100 | #35 | Exceptional 41.8% |
| Immigrants | Azores | 100.0 /100 | #36 | Exceptional 41.7% |
| Immigrants | Congo | 100.0 /100 | #37 | Exceptional 41.7% |
| Sioux | 100.0 /100 | #38 | Exceptional 41.5% |
| Scotch-Irish | 100.0 /100 | #39 | Exceptional 41.5% |
| Immigrants | Liberia | 100.0 /100 | #40 | Exceptional 41.5% |
| Celtics | 100.0 /100 | #41 | Exceptional 41.3% |
Demographics Similar to Tsimshian by In Labor Force | Age 16-19
In terms of in labor force | age 16-19, the demographic groups most similar to Tsimshian are Native Hawaiian (37.4%, a difference of 0.030%), Immigrants from Poland (37.3%, a difference of 0.030%), Immigrants from Sierra Leone (37.3%, a difference of 0.10%), Arapaho (37.3%, a difference of 0.25%), and Romanian (37.5%, a difference of 0.26%).
| Demographics | Rating | Rank | In Labor Force | Age 16-19 |
| Pakistanis | 89.5 /100 | #143 | Excellent 37.6% |
| Japanese | 89.3 /100 | #144 | Excellent 37.5% |
| Paiute | 89.3 /100 | #145 | Excellent 37.5% |
| Immigrants | Western Europe | 88.9 /100 | #146 | Excellent 37.5% |
| Brazilians | 88.7 /100 | #147 | Excellent 37.5% |
| Romanians | 87.3 /100 | #148 | Excellent 37.5% |
| Native Hawaiians | 85.0 /100 | #149 | Excellent 37.4% |
| Tsimshian | 84.7 /100 | #150 | Excellent 37.4% |
| Immigrants | Poland | 84.4 /100 | #151 | Excellent 37.3% |
| Immigrants | Sierra Leone | 83.6 /100 | #152 | Excellent 37.3% |
| Arapaho | 81.8 /100 | #153 | Excellent 37.3% |
| Immigrants | Bulgaria | 81.6 /100 | #154 | Excellent 37.3% |
| Immigrants | Lithuania | 80.7 /100 | #155 | Excellent 37.2% |
| Kiowa | 80.4 /100 | #156 | Excellent 37.2% |
| Immigrants | Brazil | 76.5 /100 | #157 | Good 37.1% |