Immigrants from Peru vs Cajun In Labor Force | Age 20-24
COMPARE
Immigrants from Peru
Cajun
In Labor Force | Age 20-24
In Labor Force | Age 20-24 Comparison
Immigrants from Peru
Cajuns
74.5%
IN LABOR FORCE | AGE 20-24
10.6/ 100
METRIC RATING
218th/ 347
METRIC RANK
75.1%
IN LABOR FORCE | AGE 20-24
51.1/ 100
METRIC RATING
171st/ 347
METRIC RANK
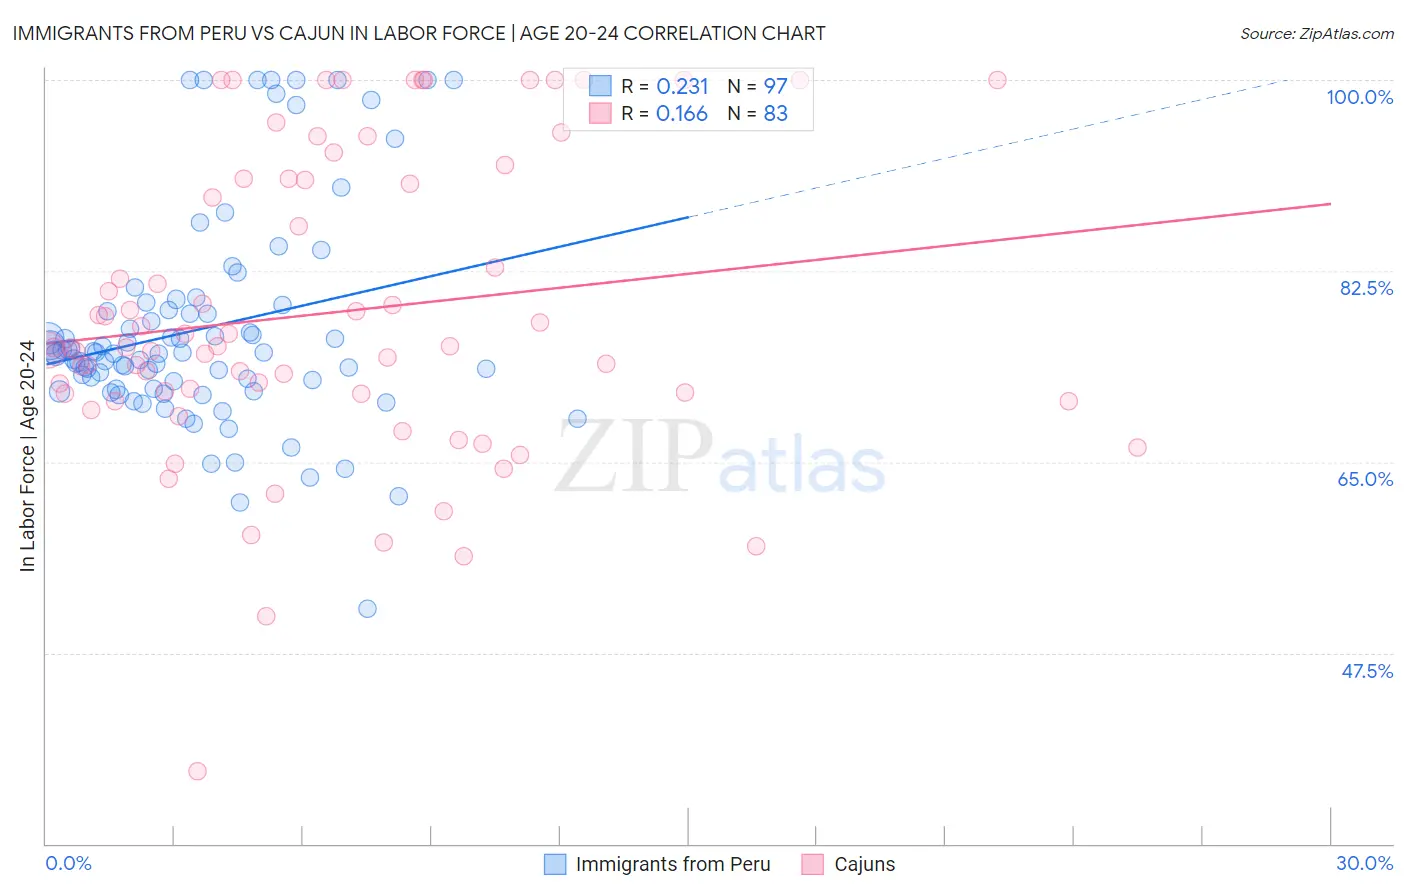
Immigrants from Peru vs Cajun In Labor Force | Age 20-24 Correlation Chart
The statistical analysis conducted on geographies consisting of 328,786,858 people shows a weak positive correlation between the proportion of Immigrants from Peru and labor force participation rate among population between the ages 20 and 24 in the United States with a correlation coefficient (R) of 0.231 and weighted average of 74.5%. Similarly, the statistical analysis conducted on geographies consisting of 149,676,462 people shows a poor positive correlation between the proportion of Cajuns and labor force participation rate among population between the ages 20 and 24 in the United States with a correlation coefficient (R) of 0.166 and weighted average of 75.1%, a difference of 0.81%.
In Labor Force | Age 20-24 Correlation Summary
| Measurement | Immigrants from Peru | Cajun |
| Minimum | 51.5% | 36.6% |
| Maximum | 100.0% | 100.0% |
| Range | 48.5% | 63.4% |
| Mean | 77.2% | 78.7% |
| Median | 75.0% | 75.5% |
| Interquartile 25% (IQ1) | 71.7% | 71.2% |
| Interquartile 75% (IQ3) | 79.1% | 90.9% |
| Interquartile Range (IQR) | 7.5% | 19.7% |
| Standard Deviation (Sample) | 9.9% | 13.7% |
| Standard Deviation (Population) | 9.9% | 13.7% |
Similar Demographics by In Labor Force | Age 20-24
Demographics Similar to Immigrants from Peru by In Labor Force | Age 20-24
In terms of in labor force | age 20-24, the demographic groups most similar to Immigrants from Peru are Nepalese (74.5%, a difference of 0.0%), Immigrants from Norway (74.5%, a difference of 0.010%), Chickasaw (74.5%, a difference of 0.010%), Immigrants from India (74.4%, a difference of 0.030%), and Chilean (74.5%, a difference of 0.070%).
| Demographics | Rating | Rank | In Labor Force | Age 20-24 |
| Immigrants | Australia | 14.7 /100 | #211 | Poor 74.6% |
| Creek | 13.3 /100 | #212 | Poor 74.5% |
| Peruvians | 13.3 /100 | #213 | Poor 74.5% |
| Immigrants | Southern Europe | 13.2 /100 | #214 | Poor 74.5% |
| Immigrants | Ghana | 12.7 /100 | #215 | Poor 74.5% |
| Immigrants | Kuwait | 12.7 /100 | #216 | Poor 74.5% |
| Chileans | 12.5 /100 | #217 | Poor 74.5% |
| Immigrants | Peru | 10.6 /100 | #218 | Poor 74.5% |
| Nepalese | 10.5 /100 | #219 | Poor 74.5% |
| Immigrants | Norway | 10.3 /100 | #220 | Poor 74.5% |
| Chickasaw | 10.3 /100 | #221 | Poor 74.5% |
| Immigrants | India | 9.9 /100 | #222 | Tragic 74.4% |
| Hispanics or Latinos | 7.9 /100 | #223 | Tragic 74.4% |
| Seminole | 6.9 /100 | #224 | Tragic 74.3% |
| Ghanaians | 6.2 /100 | #225 | Tragic 74.3% |
Demographics Similar to Cajuns by In Labor Force | Age 20-24
In terms of in labor force | age 20-24, the demographic groups most similar to Cajuns are Mexican (75.1%, a difference of 0.010%), Yakama (75.1%, a difference of 0.010%), Immigrants from Croatia (75.1%, a difference of 0.010%), South African (75.0%, a difference of 0.020%), and Syrian (75.0%, a difference of 0.020%).
| Demographics | Rating | Rank | In Labor Force | Age 20-24 |
| Bolivians | 64.0 /100 | #164 | Good 75.2% |
| Afghans | 63.5 /100 | #165 | Good 75.2% |
| Cambodians | 60.5 /100 | #166 | Good 75.2% |
| Immigrants | South Eastern Asia | 57.5 /100 | #167 | Average 75.1% |
| Immigrants | Western Africa | 56.7 /100 | #168 | Average 75.1% |
| Immigrants | Philippines | 55.8 /100 | #169 | Average 75.1% |
| Mexicans | 52.1 /100 | #170 | Average 75.1% |
| Cajuns | 51.1 /100 | #171 | Average 75.1% |
| Yakama | 50.8 /100 | #172 | Average 75.1% |
| Immigrants | Croatia | 50.2 /100 | #173 | Average 75.1% |
| South Africans | 50.0 /100 | #174 | Average 75.0% |
| Syrians | 49.5 /100 | #175 | Average 75.0% |
| Central Americans | 48.7 /100 | #176 | Average 75.0% |
| Immigrants | Mexico | 47.8 /100 | #177 | Average 75.0% |
| Immigrants | Central America | 45.0 /100 | #178 | Average 75.0% |